Sales Analytics
The Best Leaders Are Data-Driven
Get live sales data, gap and risk analysis, trends, and visibility into new/top opportunities. As a sales leader, it is imperative to understand who your best performing reps are and who is struggling to keep up. Similarly, get real-time information about the progress of deals through the funnel. This way, you can intervene timely and make it a win-win for all.
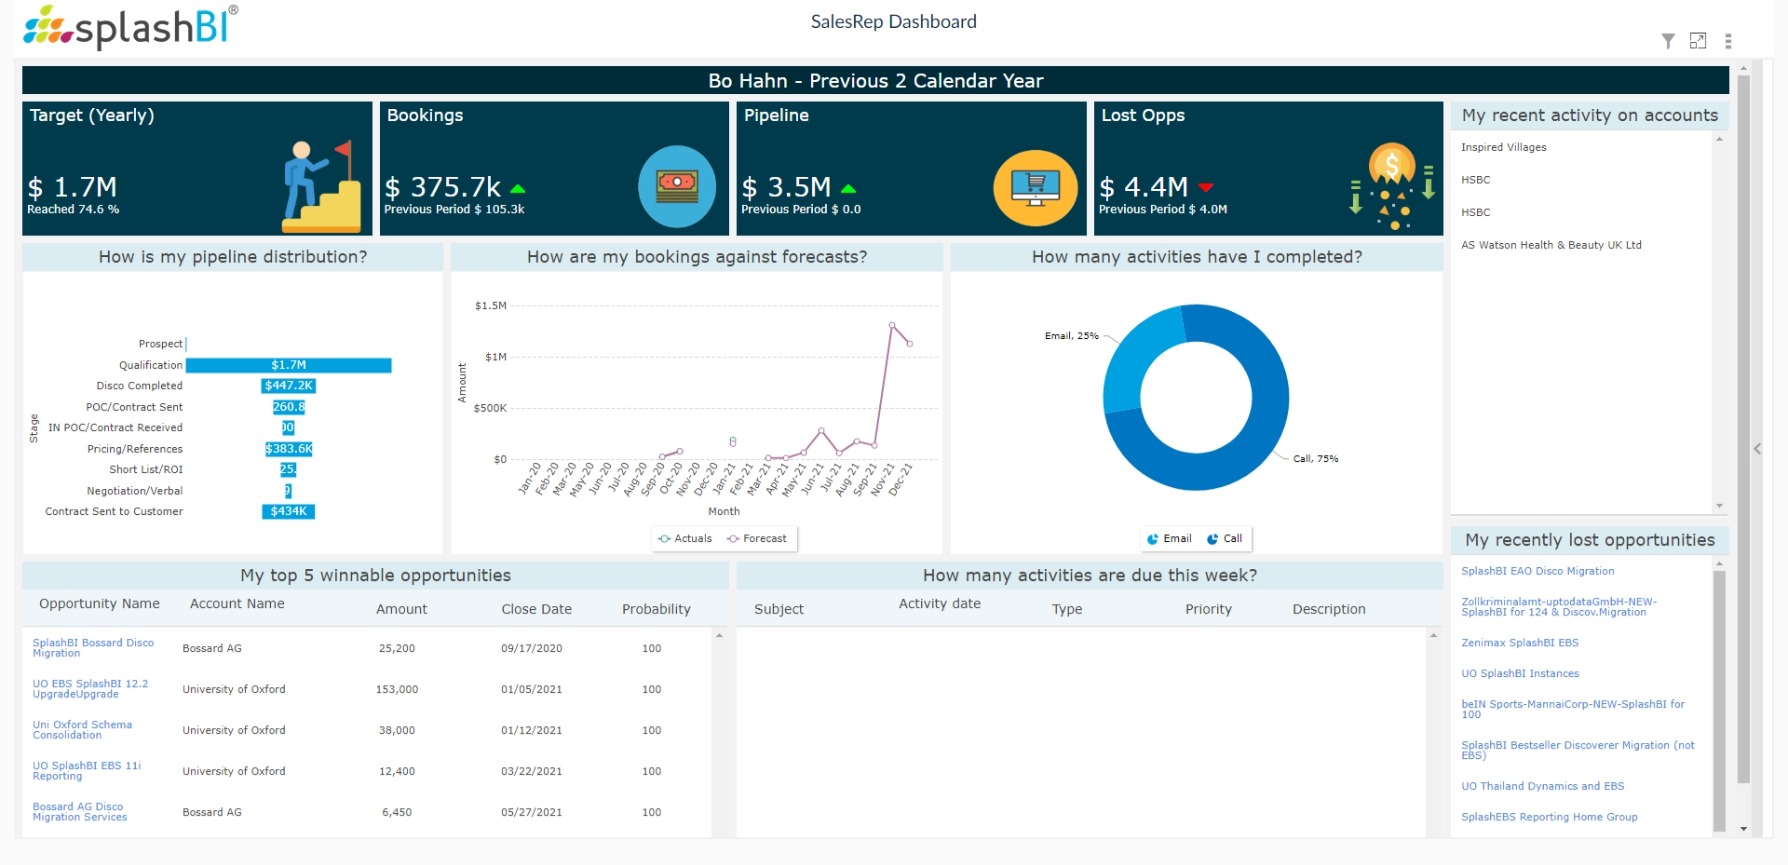
Are my sales reps performing?
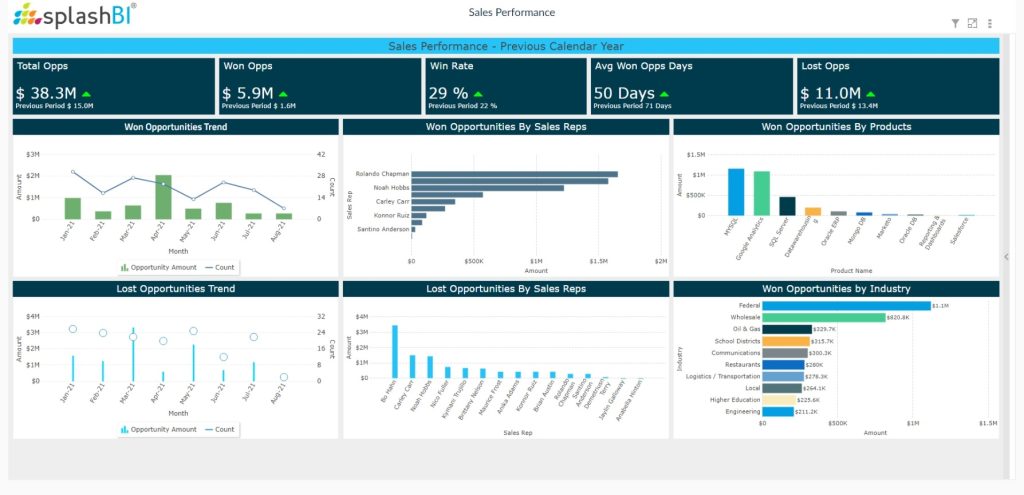
This Sales Performance dashboard shows high-level performance, broken down by rep. It details their personal pipeline details, as well as the number of open deals still being worked.
Where are we losing opportunities?
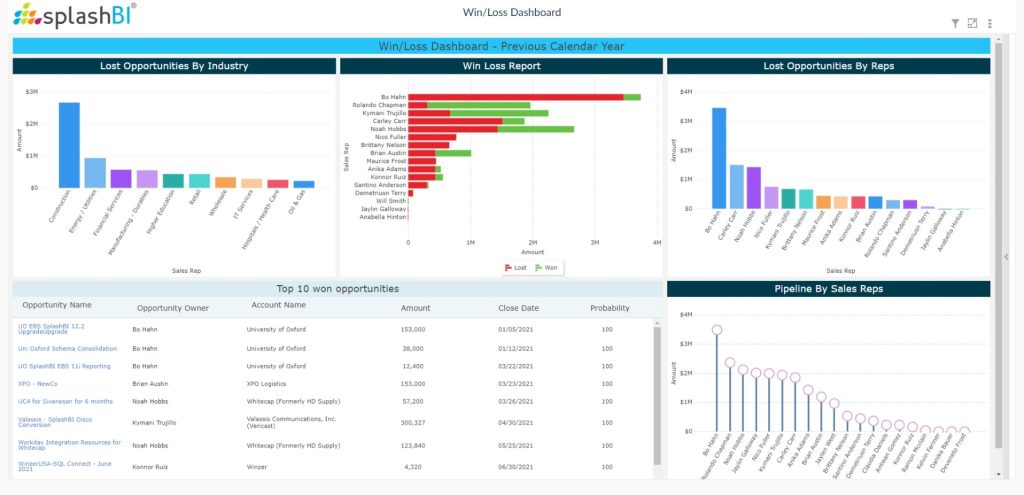
The Sales Pipeline dashboard gives detailed information about the opportunities and where they are in the sales cycle. This also allows managers to see historical pipeline at any given date, thus allowing to compare trends for a sales rep/team.
Am I doing enough to achieve my quota?
The Sales Resource Allocation dashboard acts as a kind of scoreboard for sales reps workload. It highlights which reps have too many overdue tasks as well as the reps who have a surprisingly light workload.
Explore Our Sales Analytics Dashboards For Sales Leaders
Questions Answered:
- Are our Won Opportunities trending in the right direction?
- Which Sales Rep has been the most successful?
- Are we winning deals selling a specific product over another?
- Is there more success within certain industries?
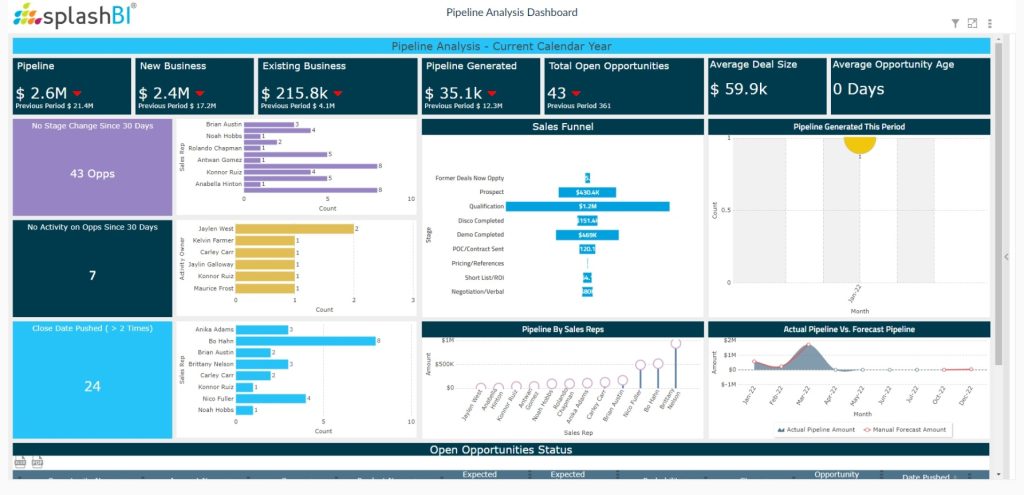
Questions Answered:
- What is our current sales funnel?
- What is our actual vs. forecast pipeline?
- Pipeline By Sales Reps?
- Pipeline current activities of opportunities?
Questions Answered:
- Wins & Losses
- Lost Opportunities By Industry
- Top 10 Won Opportunities
- Lost Opps By Sales Rep

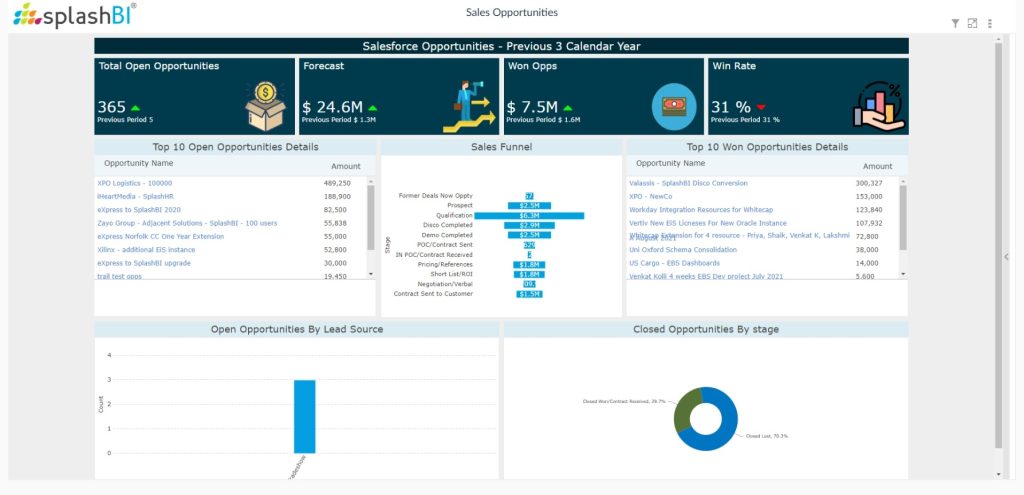
Questions Answered:
- How many open opportunities do we have?
- What is our win rate?
- Is a specific lead source contributing to opportunity generation?
- How much forecasted revenue is sitting within each stage of our sales funnel?
Questions Answered:
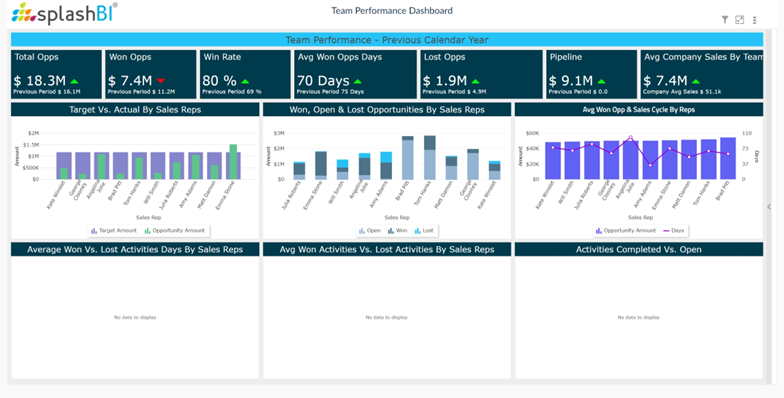
- How many won opportunities has our team generated this year?
- What is the win rate for each of my sales reps?
- What is the average time to close a deal?
- What is the revenue impact of the lost opportunities?
Questions Answered:
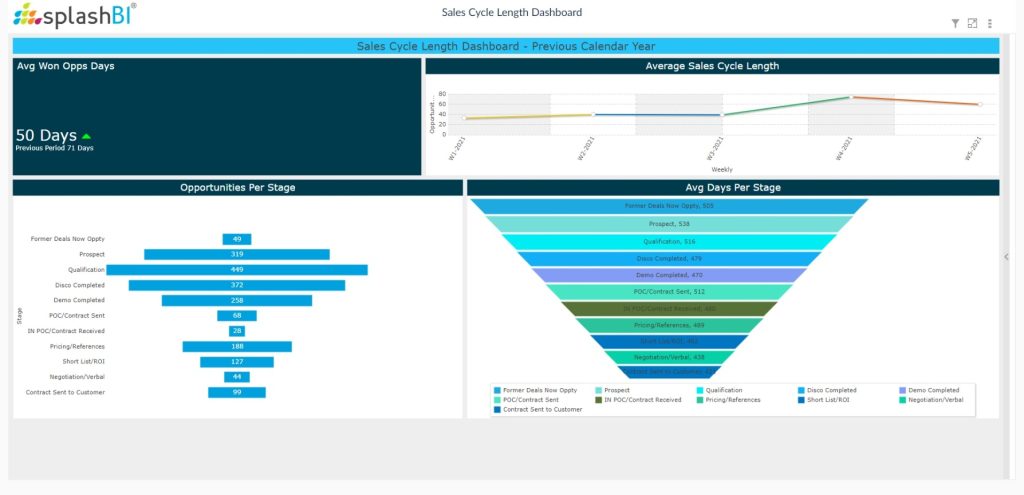
- What is the average amount of time to close an opportunity?
- What is the average sales cycle length?
- How many opportunities do we have in each stage of our funnel?
- What is the average time spent in each stage?
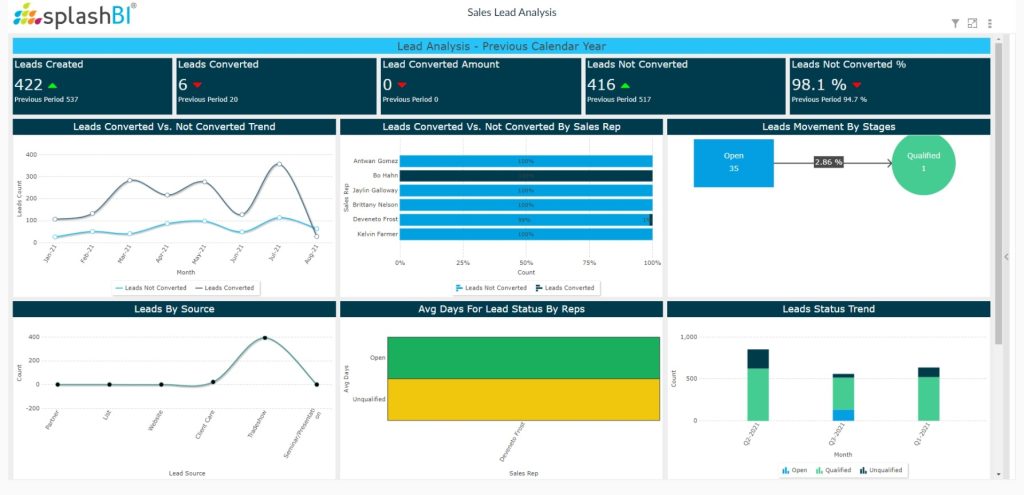
Questions Answered:
- How many new leads do we have and are we converting them?
- Where are our leads coming from?
- How long are leads sitting before being touched by a sales rep?
- What is the lead movement by stages?
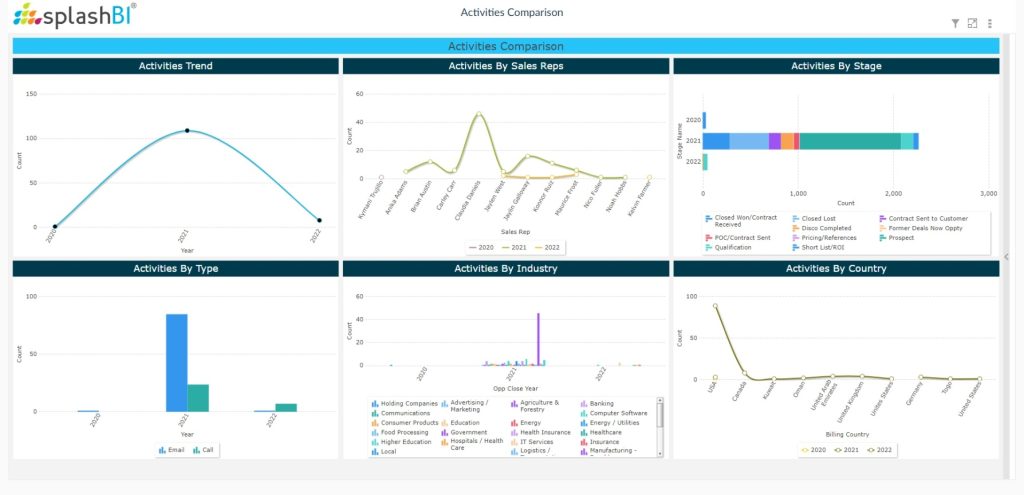
Questions Answered:
- How do the activities look by sales rep?
- What are the activities by each stage?
- Which activities have we done the most of?
- Are we spending more time on specific industries or countries?
Drive Growth WithActionable Sales Analytics
Whether you need to enable your sales reps, provide visibility for your executive team or make data-driven decisions, SplashBI for CRM has pre-built sales reports and dashboards to help. Spend less time building reports and more time driving growth with a solution built specifically around your needs.


