Sales Analytics
Sales Reps Sell Faster With Data
Eliminate the burden of manual processes for data entry, report creation, digging up account information, and more. When all the information you need is at your fingertips, your sales reps have more time to do what they do best: sell.
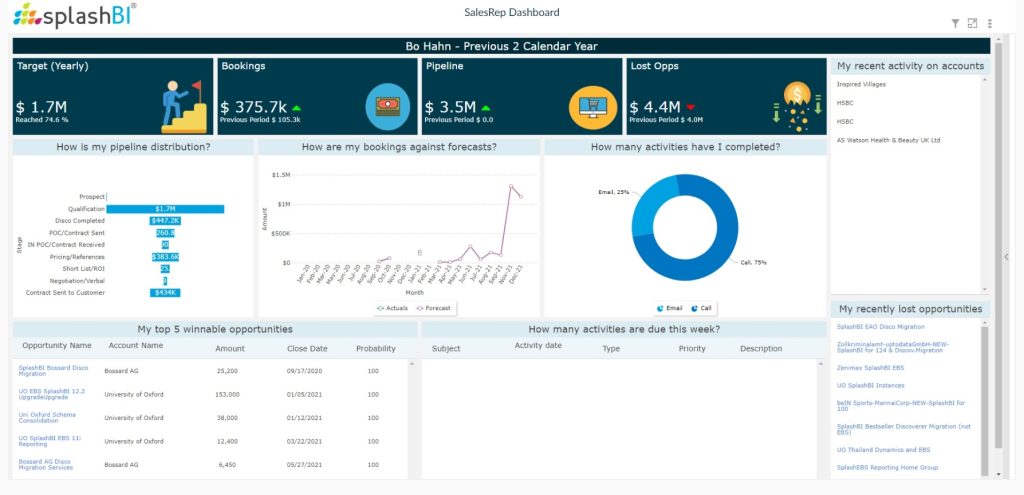
How does my pipeline look?
The Sales Pipeline Dashboard is designed to break down the key metrics of the sales pipeline. From here, sales reps can see which stage is currently most successful, and which are slowing the cycle and may need specific attention.
What are my top opportunities?
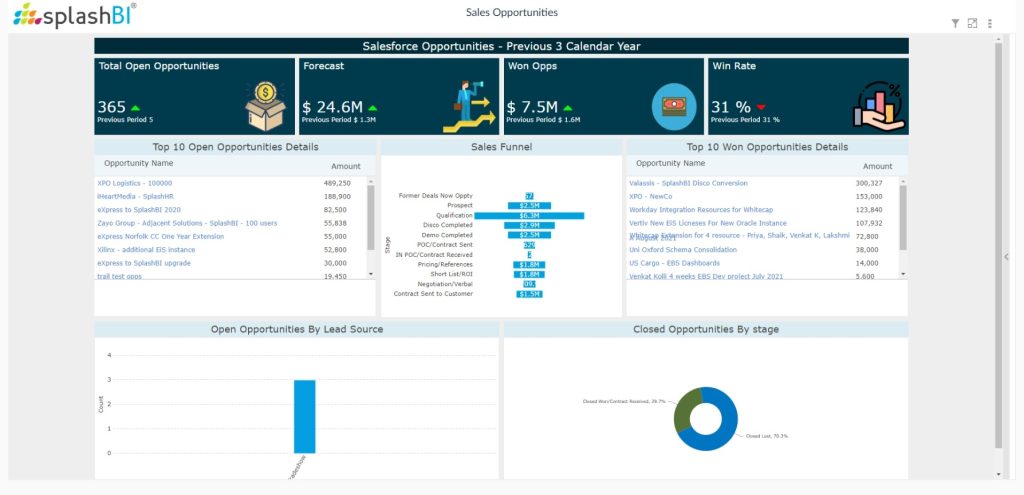
The Opportunity dashboard shows that open deals can act as a kind of to-do list. It also adds a bit of motivation: if all of those open deals can close, imagine what the company will generate in revenue.
Am I doing enough to achieve my quota?
A dashboard that lays out the current performance of your sales team can be highly motivating for your reps. A sales leaderboard will depict how each of your reps rank in terms of the metrics determined to be most impactful for your particular business.
Explore Our Sales Analytics Dashboards For Sales Reps
Questions Answered:
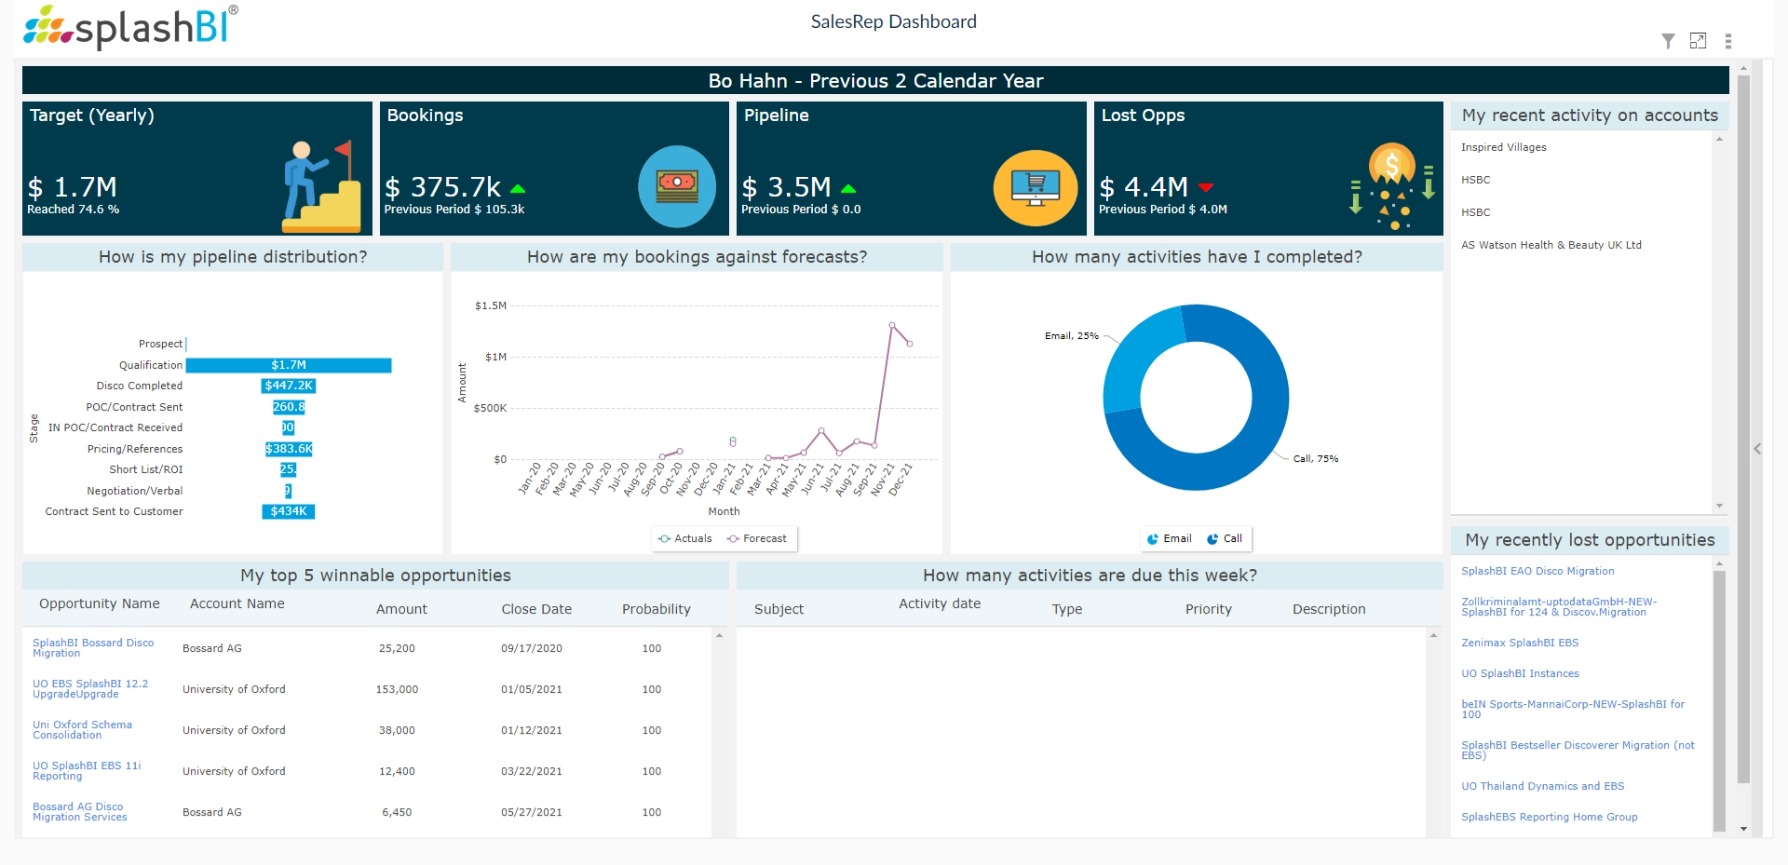
- How is my pipeline distribution?
- Is there recent activities on my accounts?
- Which opportunities have I recently lost?
- Do I have any activities that are due this week?
Questions Answered:
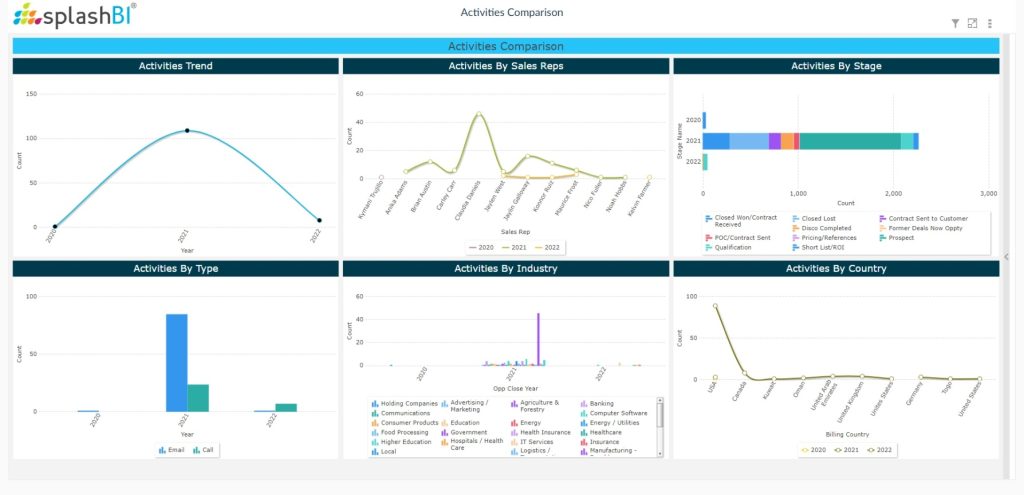
- What is the average time for first touch?
- How does our bandwidth look based on upcoming activities?
- What activity type do I do the most of?
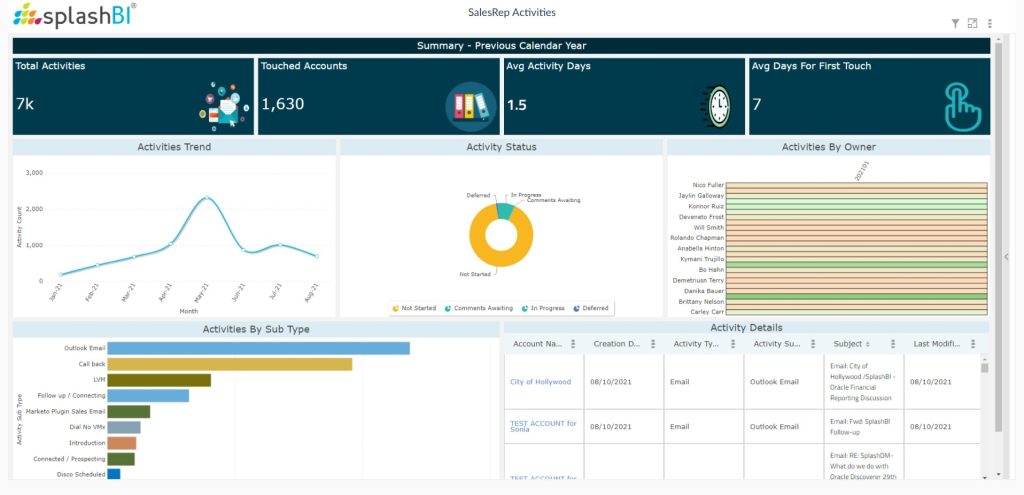
Questions Answered:
- How does my pipeline look?
- What is my average deal size?
- Do I have any opportunities that haven’t been touched recently?
- How much revenue do I have in each stage of our sales funnel?
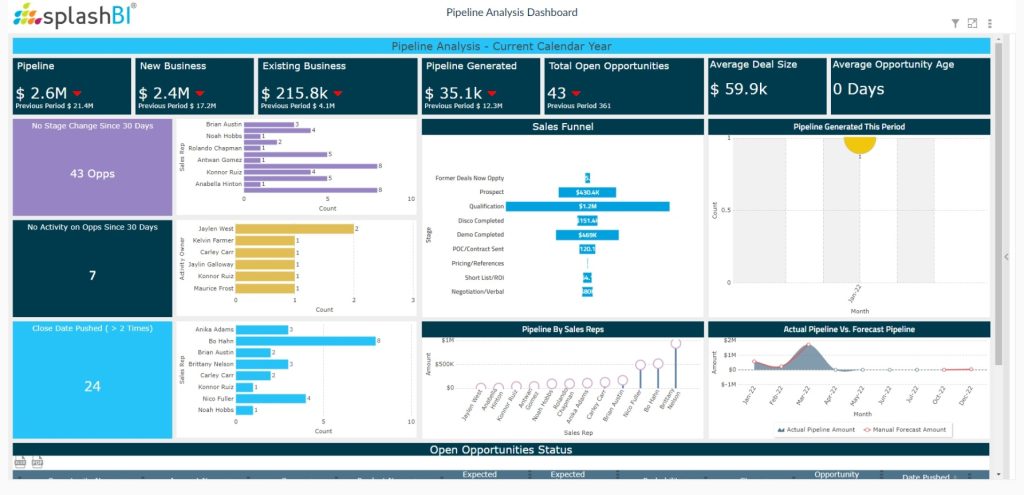
Questions Answered:
- How many open opportunities do I have?
- What is my win rate?
- Is a specific lead source contributing to opportunity generation?
- How much forecasted revenue is sitting within each stage of our sales funnel?

Questions Answered:
- How many won opportunities has our team generated this year?
- What is the win rate for each of my sales reps?
- What is the average time to close a deal?
- What is the revenue impact of the lost opportunities?
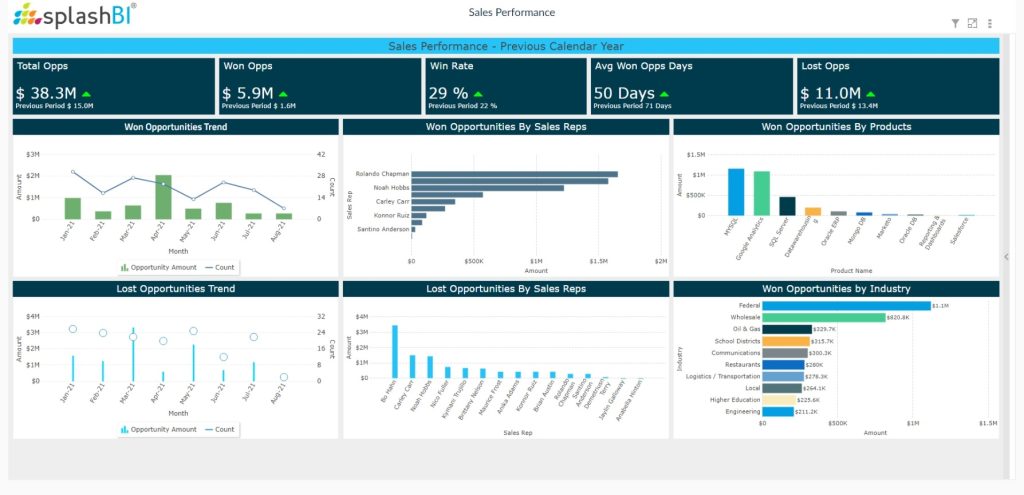
Questions Answered:
- Where are our leads coming from?
- How many have we created?
- What is the lead owner breakdown?
- Are the leads converting?
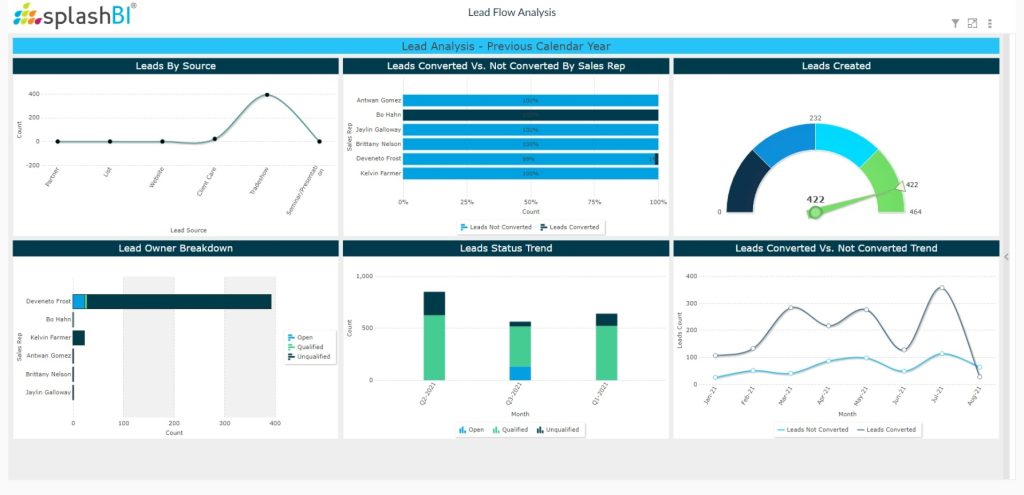
Drive Growth WithActionable Sales Analytics
Whether you need to enable your sales reps, provide visibility for your executive team or make data-driven decisions, SplashBI for CRM has pre-built sales reports and dashboards to help. Spend less time building reports and more time driving growth with a solution built specifically around your needs.


