SplashBI Reporting

Redefine Ad-Hoc
Reporting

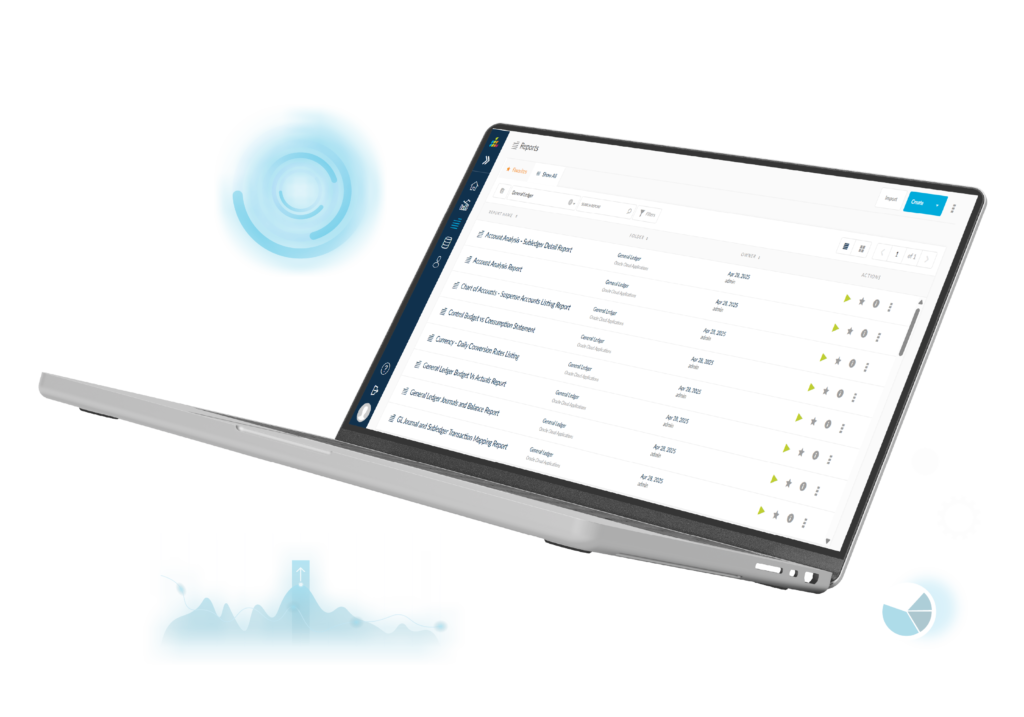
SplashBI Self-Service reporting function allows you to utilize ad hoc reporting and generate powerful reports specific to your business area. One can generate these reports in multiple formats – Pivot Table Excel, CSV, PDF, HTML, etc., including Pixel Perfect Reporting.

No Code, No IT!

The product is designed for the users, by the users while maintaining data security at all levels – Users, Operating Units, Legal Entity or even row level.

Get startedWebinar On-Demand
Ad Hoc Reporting 4

Pixel Perfect Reporting

Ad Hoc Reporting 5

Create your own ad hoc reporting layouts and produce highly formatted printable outputs (like invoices and purchase orders) with Pixel Perfect reporting in SplashBI.

Create custom cross-application on-demand reports with ease utilizing SplashBI’s drag & drop functionality.
Use the new Report Template builder to create custom RTF templates.
Produce attractive reports while maintaining complete control of the printed output.
Supports Regular and Nested XML source types for your template creation.
Ad Hoc Reporting 6

Cross Application Reporting

Do you wish it was easier to combine data from your CRM system along with Financial data from your data warehouse? SplashBI simplifies the necessary steps to compare and analyze ALL of your data in single, vibrant reports. Turning data into Business Intelligence has never been this simple!

Ad Hoc Reporting 7

Excel Reporting

Increase operational efficiency by using the Microsoft Excel add-in. You can create, run, modify, and refresh your reports directly in the Excel application. Excel Connect offers a user friendly front-end for transactional reporting that is simple to install and requires no maintenance from IT Staff.

Ad Hoc Reporting 8

Scheduling & Distribution

Automate your reporting initiative by setting your reports to run on specific schedules. Need to share that report with other users? Distribution options include peer to peer sending, and also applying the report to your FTP or File System directory. Combine both functionalities for total automation!

Ad Hoc Reporting 9

Multi-Level Drill Down

Seeing your data is good. But understanding your data is what we all strive for. Drill down to view underlying data in your spreadsheet. Use queries to extract new data in specific formats. Even connect multiple reports to drill from one to another. SplashBI provides the analytics you need.

Additional SplashBI Resources

Challenges and Opportunities in Aligning with CSRD 1Business AnalyticsOn-Demand WebinarsResources
November 1, 2023

Challenges and Opportunities in Aligning with CSRD

Explore the Challenges faced by businesses and the opportunities...
SplashBI V5.6 - Improvements & Feature Updates 2Business AnalyticsFinancial AnalyticsOn-Demand WebinarsOracle CloudOracle E-Business SuiteResources
September 8, 2023

SplashBI V5.6 – Improvements & Feature Updates

​We are excited to announce that SplashBI 5.6 is here with several ...
#SplashTrains: How to Burst with SplashGL 3Business AnalyticsFinancial AnalyticsResourcesSplashTrains
October 3, 2023

#SplashTrains: How to Burst with SplashGL

Burst is one of the most powerful features of SplashGL and YOU are using it wrong!...

Ready to see how SplashBI can benefit your organization?

Request a Demo