Of course not. But here is the funny thing, even though we see things differently, we often gather around the same things. We will all happily watch the same film, read the same headline, or laugh at the same meme.
I was walking in the Chiltern Hills recently with an old pal, someone I have known for over 30 years. We were chatting about this and that when he casually mentioned something that stopped me in my tracks. He does not see images in his mind the way I do. Instead, he thinks in words. For me, it is a vivid mental picture with rolling hills, dappled sunlight, and a deer in the distance. For him, it is language, sentences, descriptions, the story of what is around us.
It was a lightbulb moment. Here was a person I had known for most of my adult life, and yet his inner world, how he interprets and remembers things, was completely different from mine. That realisation made me think about data. Just as some of us process the world visually, verbally, or through numbers, everyone engages with data differently. The key is meeting people where they are.

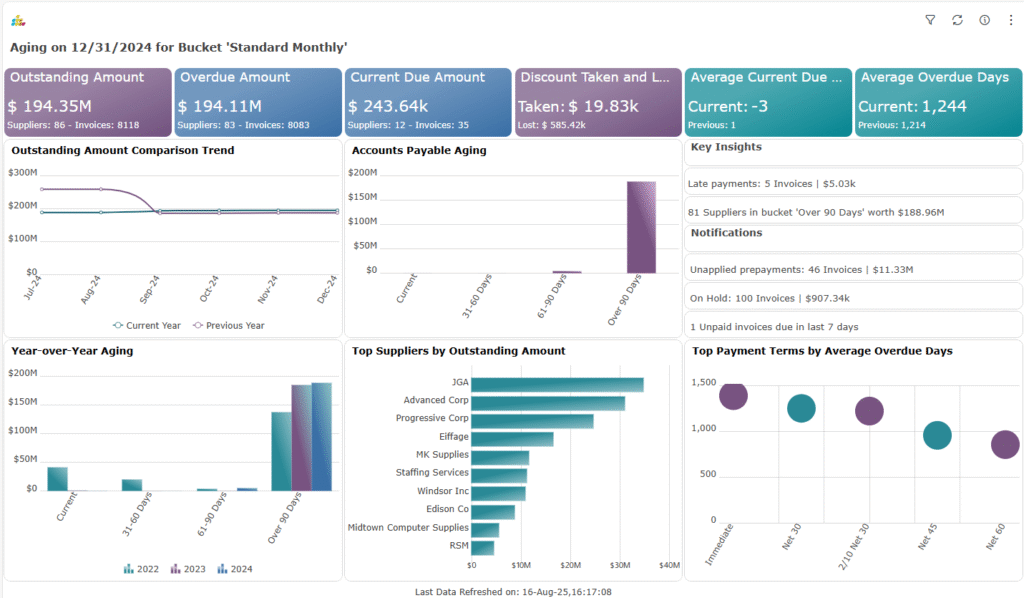
Some prefer pictures. Dashboards and charts can tell the story instantly.

Others prefer words. They want the numbers explained, a clear narrative with a beginning, middle, and end.
Then there are those who need the raw numbers, row by row, so they can explore and verify for themselves.

This is where the reports and dashboards of SplashBI and the insights from SplashAI really shine.
SplashBI brings the data together, organises it, and makes it accessible in different formats. Dashboards for the visual thinkers, structured tables for the numbers-first folks, either in a web interface or directly in Excel through its plugin. You work with the numbers in the way that suits you best.
Our leaders and employees love the look of the sleek dashboards, and it will save them so much time as they previously calculated all of their metrics manually or had difficulty using our existing tools
HR Business Application Manager, Merz Aesthetics (extract).
SplashAI adds context. It explains what is happening in plain language, like a colleague quietly saying, “Sales dropped last quarter because orders slowed down in Europe.” Suddenly the story is clear to the word people too.
Together, they make data inclusive. The finance lead who needs a precise table, the marketing manager who prefers a dashboard, and the strategy director who wants the story in words can all see the same truth in their own way. More importantly, it draws people in. When data speaks to you in a format you understand, it does not just inform, it sparks questions and creates the desire to dig deeper. That curiosity is what turns information into real insight.
The best part is it saves time such as less manual effort, more time to focus on the outcomes and quicker alignment across your teams leading to faster decision making. No one needs to rework a spreadsheet into a chart or turn a dashboard into bullet points. With SplashBI as the foundation and SplashAI providing interpretation, the insight is ready to be seen, read, or explored however you prefer.
So, do we all see the world through the same eyes? Not at all. But with the right tools, we do not have to. We can approach data in our own way and still arrive at the same understanding. In a world where decisions are only as good as the information behind them, that inclusivity makes all the difference.

Marc McGurk
Solutions Consultant, SplashBI


