How to Join Two Subject Areas in OTBI, Build Better Analyses, and Overcome Oracle Fusion OTBI Limitations
Oracle Cloud adoption is rising quickly across industries. Oracle HCM Cloud, Oracle ERP Cloud, and Oracle SCM Cloud continue to scale, and with that growth comes an increasing demand for flexible, accurate reporting.
This is where OTBI, part of the Fusion Transactional Business Intelligence cloud service, comes into the picture. OTBI offers real-time analytics by exposing business-critical data through predefined subject areas. It works well for operational snapshots, but many users struggle once they need cross-functional insights or want to join two subject areas in OTBI.
This page explains the challenges, how subject areas work, how to join two subject areas in OTBI, and where OTBI falls short. It also shows how SplashBI fills the reporting gaps for Oracle Fusion.
What is OTBI?
OTBI, short for Oracle Transactional Business Intelligence, is a real-time reporting layer within Oracle Fusion Applications. It provides a library of out-of-the-box OTBI reports in Fusion and also lets users create custom analyses using drag-and-drop fields inside predefined OTBI subject areas.
Examples of standard OTBI reports include:
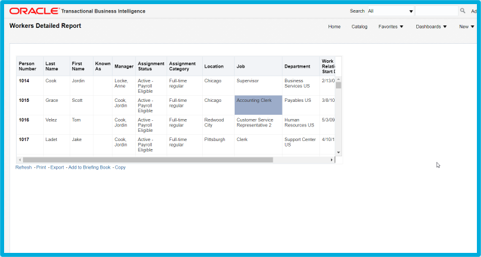
1. HR reports
This is a detailed report which shows all the details of employees in the organization from an HR standpoint – their HR attributes, the location, job, etc.
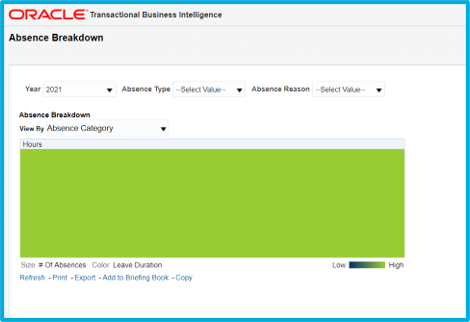
2. Absence Breakdown
This provides visual reports, where you can select your years and see how many hours of absence people have taken.
3. General Journals Report
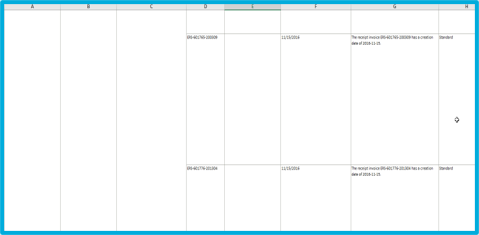
Similarly, there are other reports on the financial areas and supply chain. GL journal reports is when you export one of the standard OTBI reports to excel. It just shows you all the journal entries, and you can look at what entries are made in a time Range and for what organizations. They cover a wide area of your SaaS applications.
What Are Subject Areas in OTBI
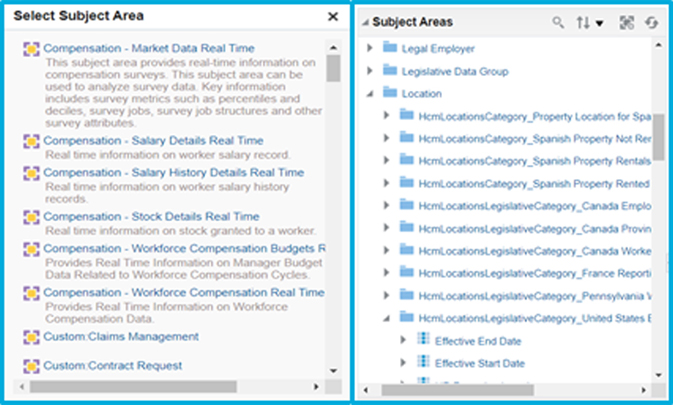
Oracle Fusion provides predefined subject areas to help users create reports without needing SQL. These subject areas are logical groupings of related attributes.
Examples include:
- General Ledger
- Payables Invoices
- Absences
- Workforce Management
- Journals
- Projects
- Payroll details
When creating analyses, users select a subject area and then drag and drop fields. OTBI exposes facts, dimensions, folders, and subfolders for building analyses.
Subject areas are central to understanding how OTBI works. They define the available joins, control what can be combined, and govern whether a report will run successfully.
How to Create Reports in OTBI?
To build custom analyses, users generally follow these steps:
- Learn the structure of relevant subject areas.
- Select a subject area and explore its folders.
- Drag and drop fields onto the canvas.
- Apply formatting, prompts, sorts, and filters.
- Add pivot tables or charts.
- Validate the output and adjust based on data needs.
Combine Subject Areas in Analyses
Cross-subject reporting is one of the most sought-after capabilities in OTBI. Teams often want views that combine HCM and Payroll, GL and Subledger Accounting, Projects and Procurement, or other combinations.
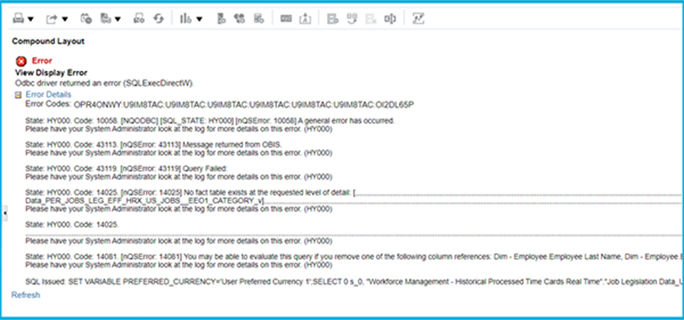
OTBI supports multi-subject reporting in theory, but only when the subject areas share compatible dimensions. In practice, users frequently encounter errors because the join conditions are not automatically obvious.
Why does this generally happen? Because the fields we drag and drop are not what OTBI was expecting? And when you’re running to this error message, it is not super descriptive and doesn’t tell you what to do to fix the problem.
About Cross-Subject Area Joins
Using common dimensions
Some Oracle Fusion OTBI subject areas share global dimensions such as Ledger, Business Unit, Worker, Assignment, or Project. When two subject areas share a common dimension, OTBI can often perform a join and return a combined dataset. This is the cleanest scenario.
Using common and local dimensions
Some subject areas include dimensions that are shared plus additional local dimensions that only exist within one module. In these situations, OTBI may allow the join but may produce unexpected results or mismatched row counts if filters are not aligned.
Combining more than one result set from different subject areas
When more than two subject areas must be combined, users often need multiple result sets. OTBI attempts to merge these sets, but mismatched grain, missing join keys, or incompatible dimensions usually generate cryptic error messages. Many users report that OTBI does not clearly explain why a join fails or how to fix it.
Create a Cross-Subject Area Analysis
The process to join two subject areas in OTBI generally includes:
- Selecting a primary subject area.
- Adding a secondary subject area if OTBI allows it.
- Validating that both subject areas share compatible dimensions.
- Testing filters to ensure the datasets match in grain.
- Adjusting fields until the join is successful.
If compatible dimensions do not exist, OTBI returns an error. This is why cross-subject reporting is one of the top limitations users face inside the OTBI Oracle Cloud ecosystem.
OTBI Challenges
Customers who rely heavily on OTBI report common issues, including:
- Missing datasets
- Difficulty joining multiple subject areas
- Inability to report on legacy or external applications
- No on-the-fly report modifications
- Payroll reports tied to Payroll flows
- No multi-threaded run options
- A 75,000 row limit
- No option to add more subject areas
- No Excel plug-in
- High time to value
These challenges increase as organizations mature and require reporting that crosses functional boundaries.
BI Publisher and its Limitations
BI Publisher is often seen as the next option when OTBI cannot support the reporting requirement. However, BI Publisher demands:
- Strong SQL knowledge
- Understanding of entity relationships
- Manual data security setup
- RTF template development
- High maintenance effort
- Longer turnaround time
BI Publisher offers greater flexibility, but at a high technical cost.
SplashBI for Oracle Fusion Cloud
SplashBI offers a balanced alternative that closes the gaps in OTBI and BI Publisher. It provides a middle ground with pre-built cross-subject area reports, better performance, Excel integrations, and no lineage maintenance required on your end.
Highlights include:
- No 75,000 row limit
- Full Excel plug-in for ad hoc analysis
- No RTF templates needed
- Reduced dependency on entity-relationship expertise
- Hundreds of pre-built HCM, Financials, and SCM reports
- Automatic updates aligned with Oracle Fusion changes
- 700+ pre-built reports
This reduces reporting workload and removes the need to build or maintain OTBI subject areas manually.
Conclusion
Users can continue depending on OTBI, learn SQL for BI Publisher, or consider Oracle Analytics Cloud. SplashBI offers a simpler, scalable, and faster way to achieve cross-subject reporting that OTBI alone cannot support. It streamlines operational reporting, reduces maintenance, and enhances decision-making with pre-built Oracle Cloud reports.
SplashBI closes the gaps that OTBI cannot fill. It strengthens your reporting foundation without the technical burden of maintaining subject areas or SQL models.


