SplashBI Excel Reporting
Microsoft Excel,Meet SplashBI
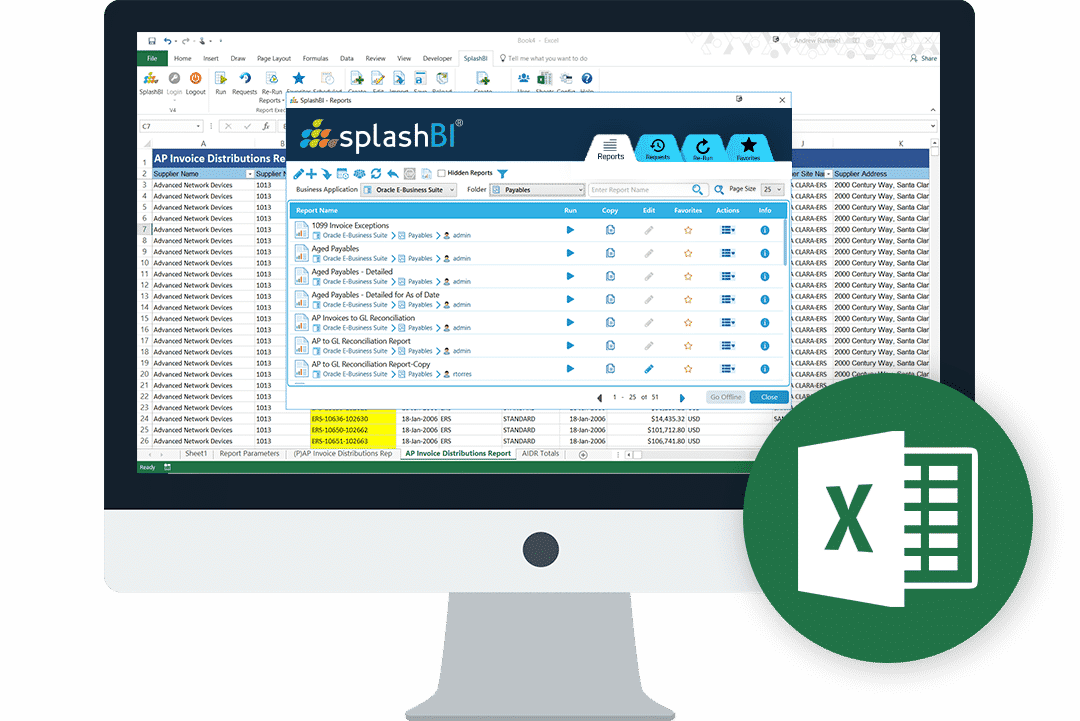
SplashBI provides a Microsoft Excel add-in as an included addition to your BI suite. Excel Connect offers a user-friendly front-end for transactional reporting within Microsoft Excel that is simple to install and requires no maintenance from IT Staff.
Excel Connect is an Excel reporting tool within SplashBI suite, which provides users with the ability to run reports, ad hoc where needed, and refresh time after time while retaining all formats, graphs, pivots, and formulas, perfect for creating dashboards in excel. SplashBI provides this reporting tool within its BI suite, unlike most other Excel reporting tools.

Full Reporting Functionality
With Excel Connect, users can accomplish their entire Excel reporting needs in a user-friendly interface. Create custom reports from scratch, set up schedules and distribution lists, and run all your reports directly in the Excel application.
Retain Excel Formatting
Don’t be afraid to use the Excel formatting options natural to the application. Highlight columns; add charts, pivot tables, modify fonts, and colors. All these changes will stick around every time you refresh your data!
Refresh
Reports
Excel Connect allows users to save their reports in a single workbook for future use. With a single click, update the data in multiple reports simultaneously. Save hours each week in your reporting tasks without having to replicate your efforts.
Custom
Formats
Like the changes and additions you made to a report? In Excel Connect, users can upload new formats to their reports back to the SplashBI server for use amongst other users in the organization.
Reporting Without Limits.
Drill Downs
Additional insight into your data without having to run additional reports or go into other systems! Drill downs can also be modified and new ones created, so you aren’t limited with your data insight.
Scheduling & Distribution
Your reports and save time and effort! SplashBI lets you set up your reports to run at a specific date and time, or have them run at a recurring interval. You can even have them distribute automatically to a specific person or group of people once the report completes.
Consolidate Reporting
You report from Excel with SplashBI; you can centralize your reports and save time and effort. From Excel, you can run reports from various sources, and even create reports combining that data, meaning less manual work.


