Sales Analytics
Executives Make Smarter Decisions With Data
Data that comes even a few days late can be outdated and unusable. With real-time data analysis and visual dashboards, you can make real-time decisions that drive your revenue forward. Identify your highest priorities with intelligence and data visualization tools built around your business.
Which product has the best pipeline?
This Product Performance dashboard shows a handful of performance metrics for several different products. It also highlights the difference between online and in-store sales, as well as which campaigns were most effective.
Are we projected to hit quota?
The Sales Trends dashboard shows the overall trends and progress of your sales team. It’s broken down on a monthly basis, quarterly, or yearly basis.
Do we have any neglected accounts?
The Sales KPI Dashboard is a bit more high-level, showing a variety of sales kpi’s such as neglected accounts, margin by rep, or deal size vs. discount.
Explore Our Sales Analytics Dashboards For Sales Executives
Questions Answered:
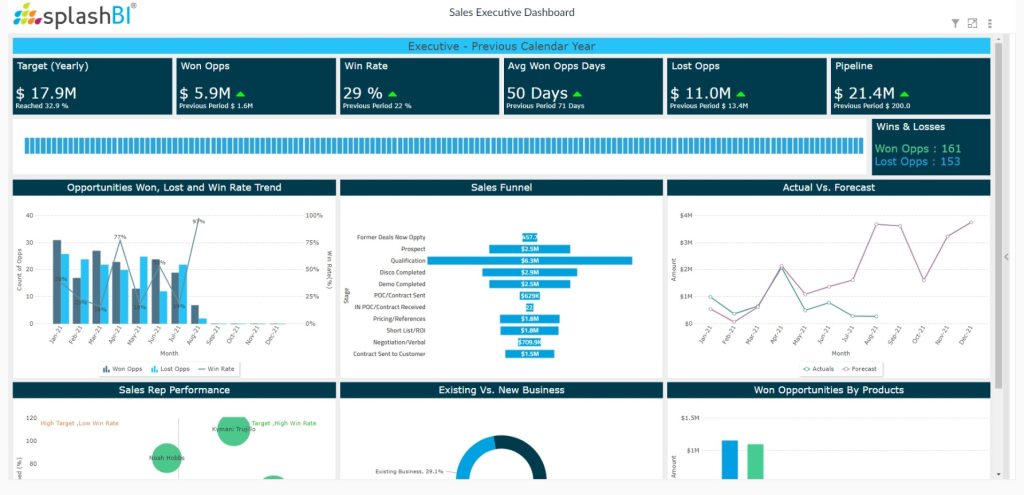
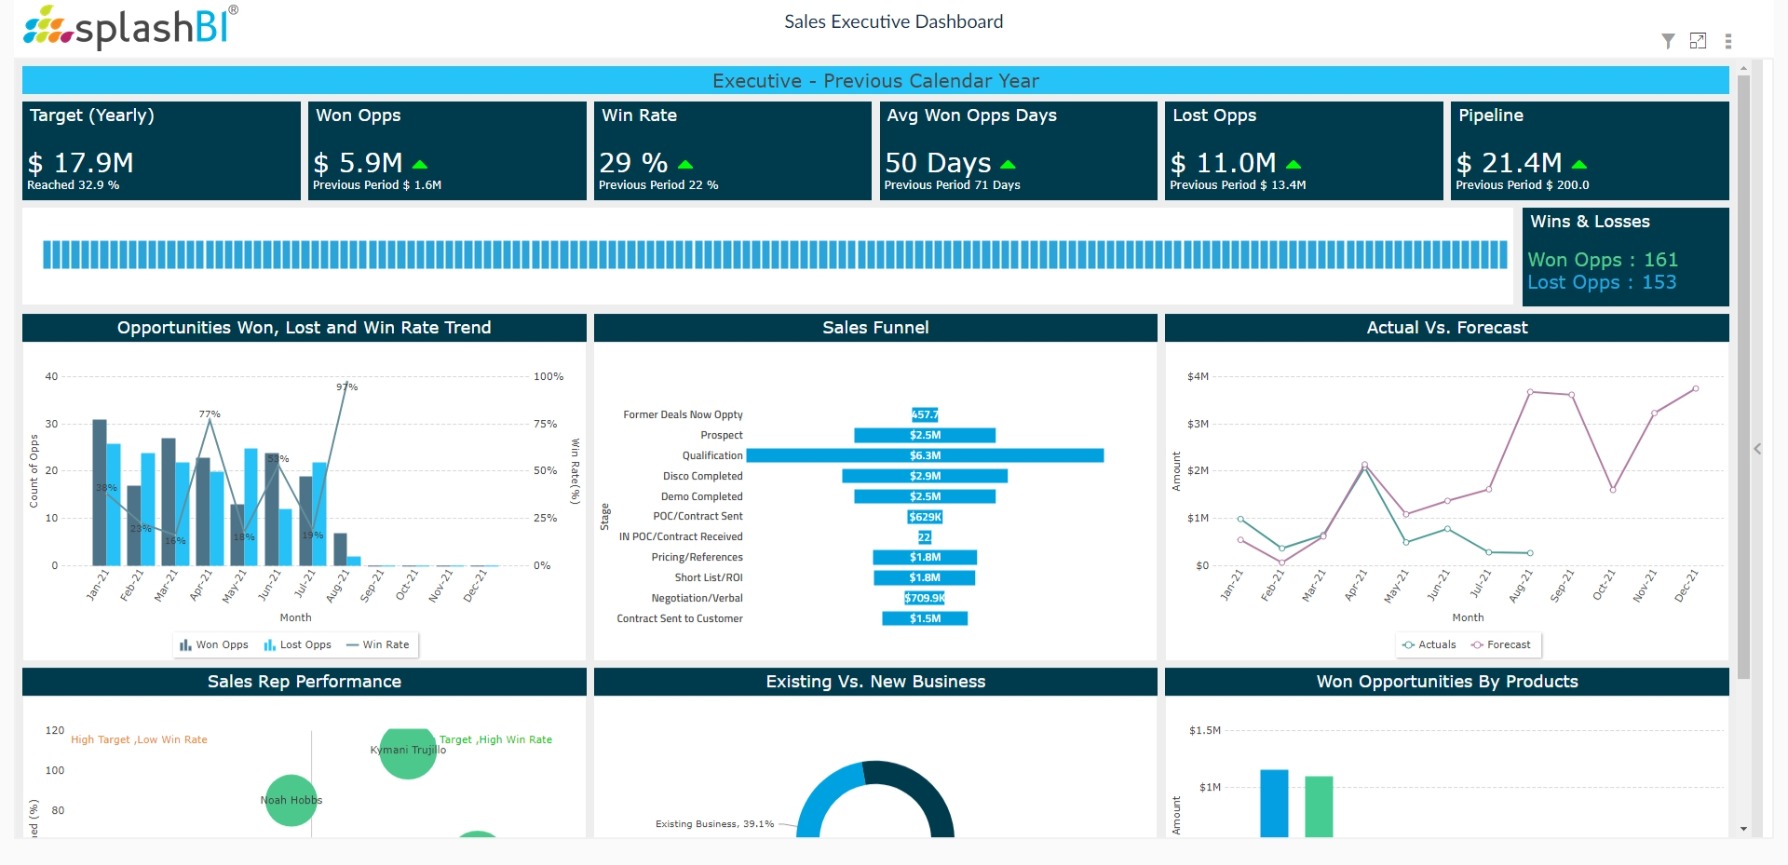
- How do we look against our target?
- Are we winning more opps than we are losing?
- Where do we stand against our forecasted revenue?
- What percentage is coming from new business vs existing?
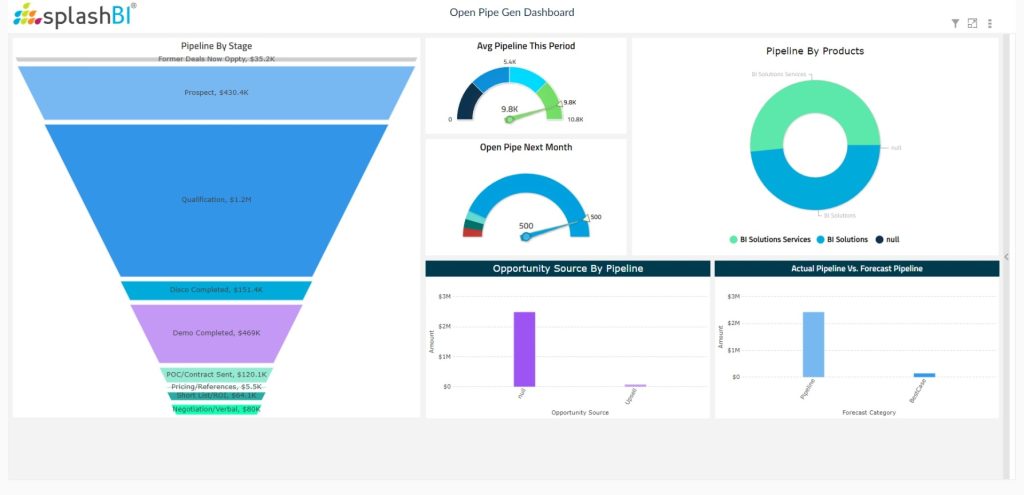
Questions Answered:
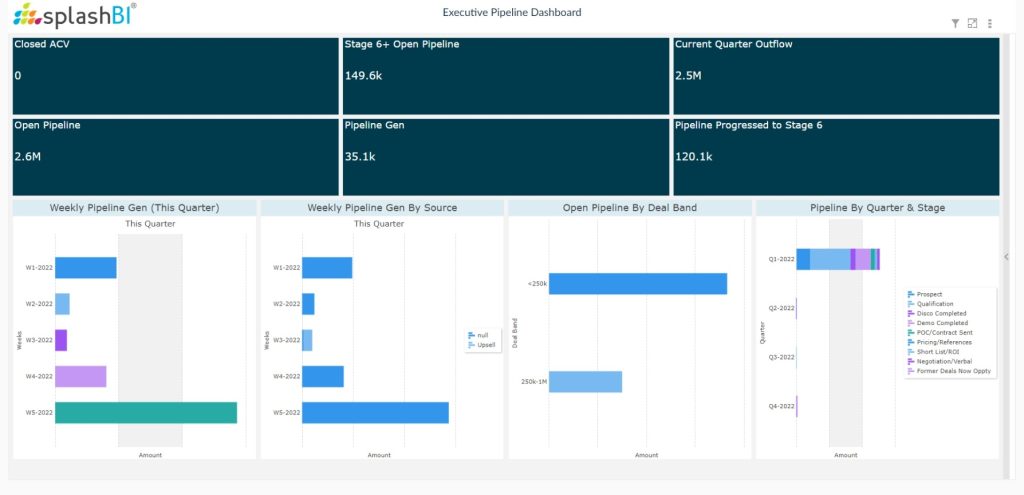
- How does the pipeline look by stage?
- What is the average pipeline this quarter?
- What is the pipeline by products?
- Is our pipeline healthy?
Questions Answered:
- How much revenue have we generated?
- What was generated this quarter?
- Where did our generated pipeline come from?
- How much of our pipeline is stuck in the final stage?

Questions Answered:
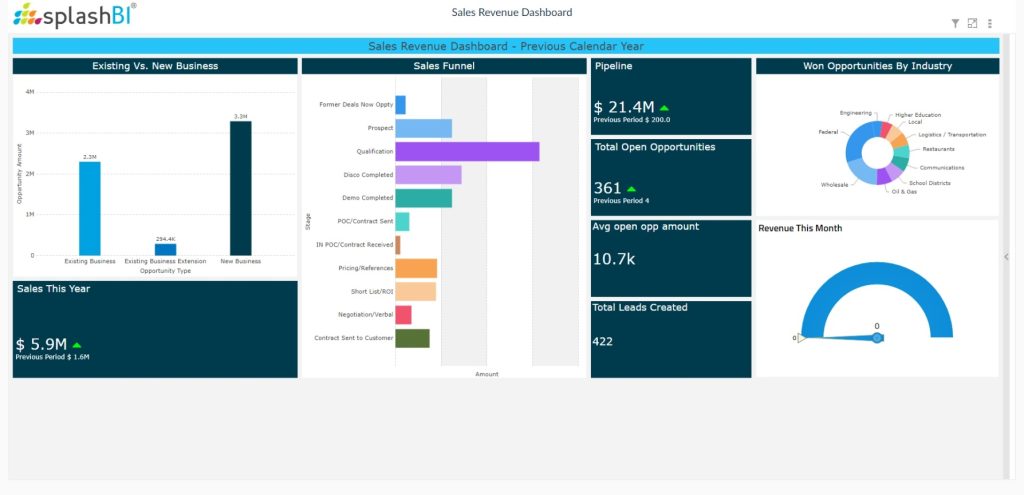
- What is our revenue generated this year?
- What side of the business contributed the most?
- Do we have enough open opportunities to hit quota?
- Have we created enough leads to have a healthy pipeline?

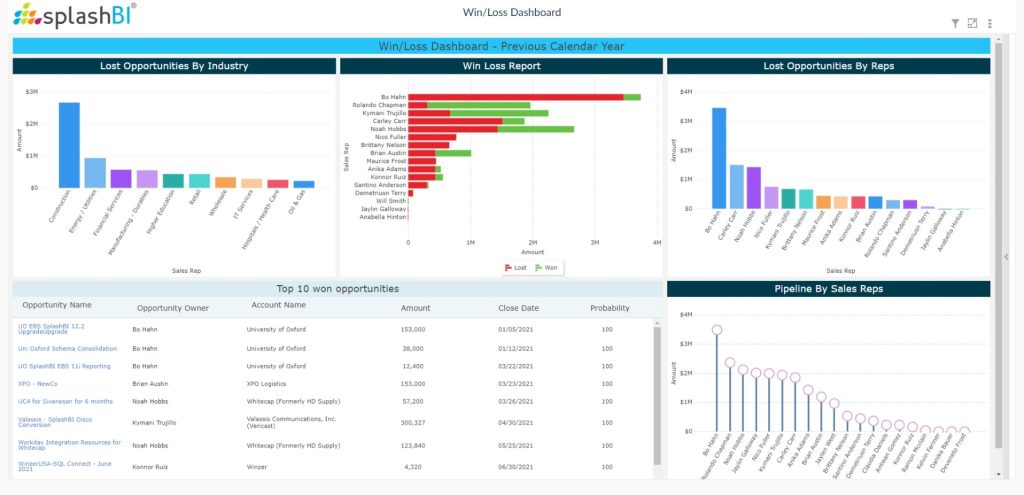
Questions Answered:
- Wins & Losses
- Lost Opportunities By Industry
- Top 10 Won Opportunities
- Lost Opps By Sales Rep
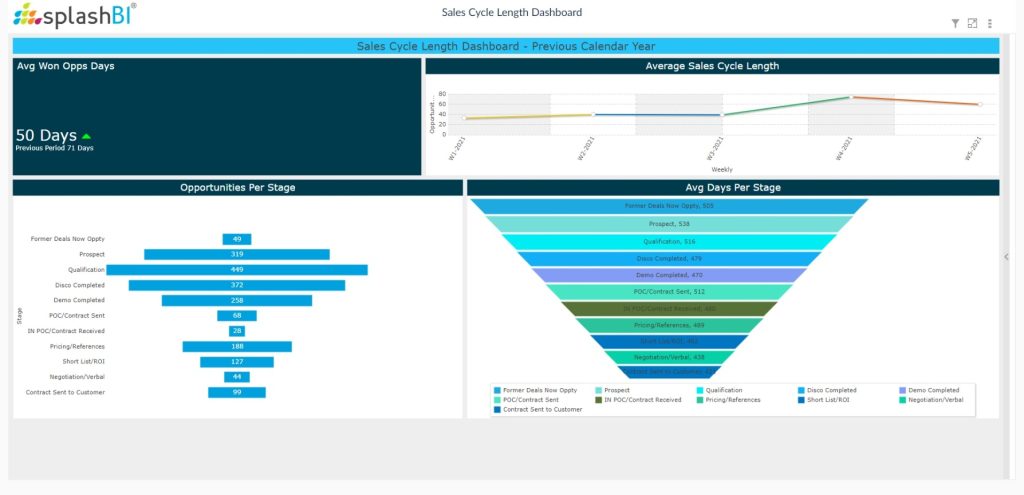
Questions Answered:
- What is the average amount of time to close an opportunity?
- What is the average sales cycle length?
- How many opportunities do we have in each stage of our funnel?
- What is the average time spent in each stage?
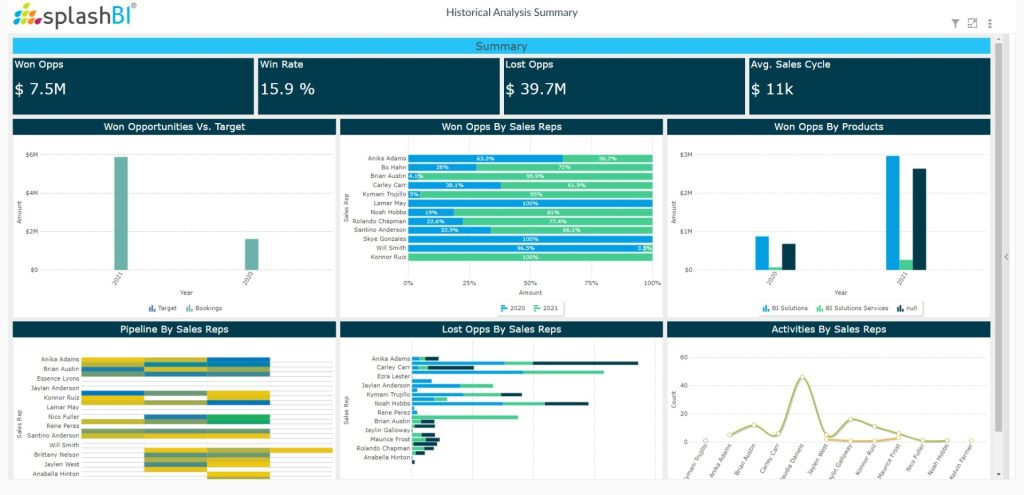
Questions Answered:
- How do our opportunities compare to previous years?
- Have our sales reps won more opps than last year?
- Which products have performed the best over time?
- Is our pipeline growing or shrinking?
Drive Growth WithActionable Sales Analytics
Whether you need to enable your sales reps, provide visibility for your executive team or make data-driven decisions, SplashBI for CRM has pre-built sales reports and dashboards to help. Spend less time building reports and more time driving growth with a solution built specifically around your needs.


