

    SplashBI
    FINANCE SOLUTIONS

    Visibility That Moves Finance Forward

    From leadership dashboards to drill-down details, SplashBI puts every layer of financial insight within reach - no manual stitching required.
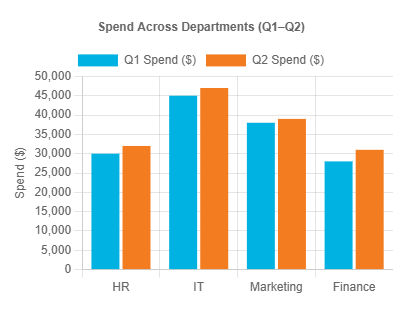
    SplashBI financial visibility dashboard

    See the Big Picture and Every Detail

    Track Spend Across Departments

    Easily view actuals by cost center, business unit, or region in real time.

    Drill into Subledger Transactions

    Click from a balance to the journal entry to the source invoice - without leaving the report.

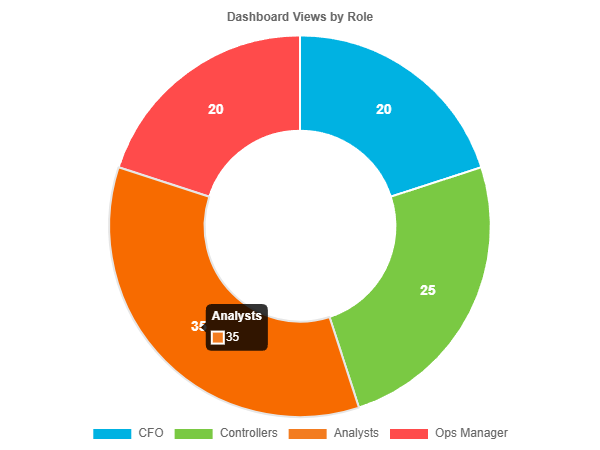
    Tailor Dashboards by Role

    Give each stakeholder the views they need, from CFOs to analysts.

    Financial Visibility, Without the Guesswork

    Manual reporting slows decision-making. With SplashBI, you get dynamic dashboards and cross-module insights that help you make better calls, faster - with data you trust.
    Can you drill from summary to source in seconds?

    Are leaders seeing numbers that match the latest actuals?

    How much time is spent building vs. understanding reports?

    Support Every Level of Finance Visibility

    From high-level KPIs to journal-level detail, SplashBI helps you connect the dots between data, decisions, and direction.

    Unify Data View

    Access comprehensive data from all modules like GL, AP, and AR in one central location.

    Access Real-Time Data

    Work with the most current numbers and insights, eliminating reliance on outdated exports.

    Use Pre-Built Dashboards

    Leverage ready-made visualizations and dashboards aligned to your key business metrics.

    Enable Drill-Down

    Start with high-level summaries and easily drill down to the original source data.

    Unify ERP Data

    Integrate data from across your ERP system to gain complete and actionable insights.

    Segment Reporting

    Segment your reporting by business unit, cost center, or region for detailed views.

    Automate Reporting

    Eliminate manual Excel merges and static PowerPoints, saving significant time.

    Explore Trends

    Easily explore financial trends and variances with dynamic, interactive dashboards.

    Accelerate Decisions

    Empower leaders with real-time financial data to make swift, impactful strategic decisions.

    Enhance Collaboration

    Bridge departmental gaps by sharing unified financial reports that resonate with all teams.

    Standardize Metrics

    Align your entire organization by ensuring consistent performance measurement and reporting.

    Drive Data Culture

    Transform your approach from reactive responses to proactive strategies with timely insights.

    FAQs

    Questions, answered

    Yes. You can click from a balance to the journal entry to the source invoice, without leaving the report.

    Tailor dashboards by role, giving each stakeholder the views they need, from CFOs to analysts.

    You work with the most current numbers and insights, eliminating reliance on outdated exports.

    Yes. Segment your reporting by business unit, cost center, or region for detailed views.

    How SplashBI Brings It All Together

    When financial visibility is built into your tools - not bolted on - decisions get easier, faster, and more aligned. SplashBI combines pre-built dashboards, flexible reporting, and drill-down access to create a single source of truth. From leadership reviews to audit prep, the right data is never more than a few clicks away.