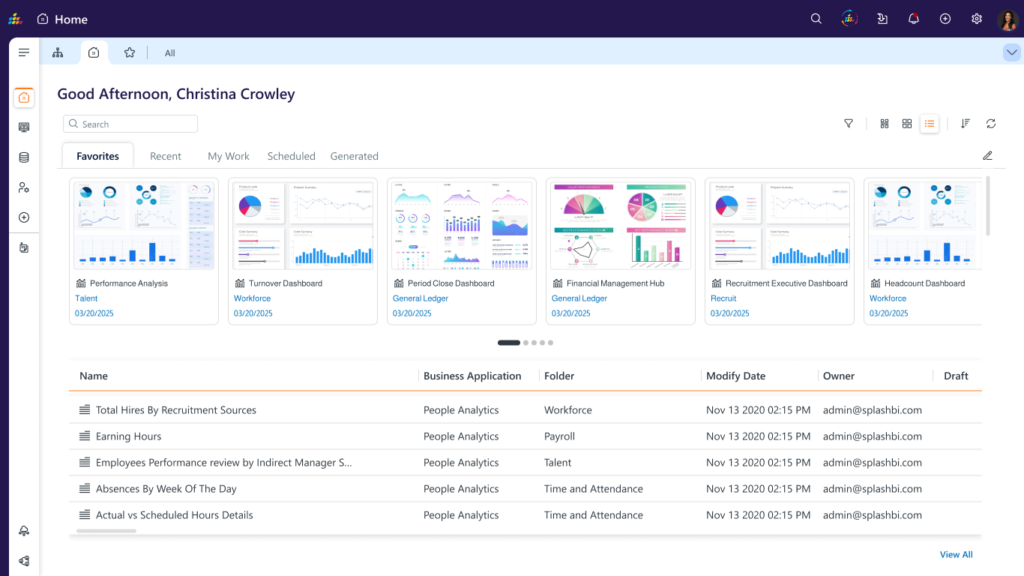
SplashBI Platform
Powerful Embedded BI, Sleek Enterprise Flexibility
We’ve revolutionized Embedded BI to make analytics seamless, powerful, and tailored to your needs. Whether you’re enhancing internal tools or creating customer-facing platforms, our cutting-edge Embedded Analytics ensures that data-driven decisions happen where they matter most.

Key Features
With a sleek design, unparalleled flexibility, and enterprise-grade capabilities, we empower you to deliver insights that fit perfectly into your workflow.
AI-Powered Advanced Analytics
Integrate contextual insights directly into your enterprise applications, enabling smarter, faster decision-making.
Interactive Reports & Dashboards
Embed dynamic reports and dashboards with live data views, filters, drilldowns, and export options.
SDK & API Integration
Easily embed rich, real-time analytics into your applications with minimal coding. Built for developers, loved by end-users.
Single Sign-On (SSO) Integration
Simplify access with unified login experiences using SAML technology, ensuring security and convenience.
Complete White-Labeling Support
Make it yours. Match your brand’s colors, logos, and themes for a seamless user experience.
Predictive Analytics & Future-Proof
Stay ahead with predictive analytics, responsive layouts, and adaptive filters. Our solution is modern, scalable, and ready for the future.
Role-Based Access Control
Implement robust, fine-grained security to manage user access to specific data and analytics features.
Flexible Deployment Options
Deploy on-premises or in the cloud—your choice, your control.
Who Benefits from Embedded Analytics?
SaaS Platforms
Deliver actionable insights directly to your customers, adding value to your offerings.
Internal Business Applications
Empower teams with data at the point of action, driving efficiency and results.
Enterprise Portals
Seamlessly integrate data visualizations into workflows for enhanced productivity.
Why Embedded BI Matters
Embedded Analytics transforms how organizations interact with data. By integrating real-time insights directly into your applications, you eliminate the need for separate tools, reduce friction, and create a seamless experience for users.
Ready to elevate your applications with Embedded Analytics? Let’s make it happen.


