

Working capital equals current assets minus current liabilities. For operational analysis, calculate operating working capital separately using receivables, inventory, other operating current assets, payables, and operating accruals.
The formula is simple. Producing a number that Treasury, Finance, and business leaders can act on is harder. The balance must be reconciled to the general ledger, classified consistently, and explained using AR, AP, inventory, and cash-management detail.
What Is Working Capital, and Which Formula Should You Use?
Working capital measures the short-term resources available after an organization accounts for its short-term obligations.
The standard formula is:
Working capital = Current assets − Current liabilities
If current assets are $8 million and current liabilities are $4 million, working capital is $4 million.
However, finance teams often need more than one working-capital view.
| Measure | Formula | Primary Use |
|---|---|---|
| Net working capital | Current assets − Current liabilities | Assess overall short-term liquidity |
| Current ratio | Current assets ÷ Current liabilities | Compare liquidity across periods or entities |
| Operating working capital | Operating current assets − Operating current liabilities | Analyze cash committed to day-to-day operations |
| Change in operating working capital | Current-period OWC − Prior-period OWC | Measure the cash impact of operational balance changes |
| Cash conversion cycle | DSO + DIO − DPO | Measure how long operating cash remains committed |
Reported net working capital normally includes cash, receivables, inventory, prepayments, payables, accruals, short-term debt, and other balances classified as current.
Operating working capital commonly excludes cash, short-term investments, current debt, and financing-related liabilities. A typical formula is:
Operating working capital = Trade receivables + Inventory + Other operating current assets − Trade payables − Operating accruals
There is no single operating-working-capital definition that fits every company. Finance should document how it treats tax balances, contract assets, deferred revenue, intercompany balances, lease liabilities, and other policy-dependent accounts.
How Do You Calculate Working Capital?
Start with reconciled current assets and current liabilities from the balance sheet, then create a separate operating view for cash-flow analysis.
Consider the following simplified closing balances:
| Account | Amount | Included in Net Working Capital? | Included in Operating Working Capital? |
|---|---|---|---|
| Cash | $2,000,000 | Yes | No |
| Trade receivables | $3,200,000 | Yes | Yes |
| Inventory | $2,400,000 | Yes | Yes |
| Other operating current assets | $400,000 | Yes | Yes |
| Total current assets | $8,000,000 | ||
| Trade payables | $2,100,000 | Yes | Yes |
| Operating accruals | $700,000 | Yes | Yes |
| Current debt | $800,000 | Yes | No |
| Other current liabilities | $400,000 | Yes | Policy-dependent |
| Total current liabilities | $4,000,000 |
Net working capital calculation
$8,000,000 − $4,000,000 = $4,000,000
The company has $4 million of net working capital.
Operating working capital calculation
Assuming other current liabilities are excluded:
($3,200,000 + $2,400,000 + $400,000) − ($2,100,000 + $700,000) = $3,200,000
If operating working capital was $2.7 million in the previous period, the increase is:
$3,200,000 − $2,700,000 = $500,000
All else being equal, that $500,000 increase represents additional cash tied up in operations. Finance should then determine whether it resulted from slower collections, inventory growth, faster supplier payments, acquisitions, foreign-exchange movements, or accounting reclassifications.
How Do DSO, DIO, and DPO Explain Working Capital?
DSO, DIO, and DPO explain how quickly operating balances move through the cash conversion cycle. Working capital measures an amount at a point in time, while the cash conversion cycle measures operating efficiency in days.
| Metric | Formula | What It Measures |
|---|---|---|
| Days sales outstanding | Average trade receivables ÷ Net credit sales × Days | How quickly customers pay |
| Days inventory outstanding | Average inventory ÷ Cost of goods sold × Days | How long inventory is held |
| Days payable outstanding | Average trade payables ÷ Credit purchases × Days | How long the company takes to pay suppliers |
| Cash conversion cycle | DSO + DIO − DPO | Days between cash commitment and cash recovery |
For example, suppose the company has:
- DSO of 48 days
- DIO of 62 days
- DPO of 44 days
Its cash conversion cycle is:
48 + 62 − 44 = 66 days
The business is funding its operating cycle for approximately 66 days.
Use average opening and closing balances for DSO, DIO, and DPO rather than a single closing balance. A month-end balance may be distorted by seasonality, payment runs, customer receipts, or inventory purchases.
DPO should ideally use credit purchases as its denominator. If purchase data is unavailable and cost of goods sold is used as a proxy, disclose that choice. Similarly, DSO is most meaningful when calculated against net credit sales rather than total revenue.
A longer DPO can preserve cash when it results from negotiated terms. It can indicate liquidity pressure when invoices are simply overdue. That is why an accounts payable aging report must accompany the ratio.
ACCA’s working-capital guidance similarly connects receivables, inventory, and payables management through the cash operating cycle.
How Do You Calculate Working Capital from Oracle?
Calculate Oracle working capital by mapping current GL accounts, reconciling each control account, and enriching those balances with Receivables, Payables, Inventory, and Cash Management detail.
| Working-Capital Component | Oracle Source | Essential Validation |
|---|---|---|
| Cash and cash equivalents | Cash Management and General Ledger | Reconcile bank balances and identify restricted or pooled cash |
| Trade receivables | Receivables and General Ledger | Reconcile open invoices, receipts, credits, disputes, and unapplied cash |
| Inventory | Inventory Management, Cost Accounting, and General Ledger | Reconcile inventory valuation, in-transit stock, WIP, and reserves |
| Prepayments and other current assets | General Ledger and relevant subledgers | Confirm current classification and expected realization period |
| Trade payables | Payables and General Ledger | Reconcile invoices, payments, holds, due dates, and supplier terms |
| Operating accruals | General Ledger and source applications | Review reversals, settlement dates, and period-end estimates |
| Current debt | General Ledger or Treasury source | Include in net working capital but exclude from the defined operating view |
| Intercompany balances | General Ledger and intercompany records | Eliminate appropriately in consolidated reporting |
A controlled Oracle process should:
- Define the ledger, legal entities, currencies, accounting period, and consolidation scope.
- Map natural accounts to current assets, current liabilities, and operating-working-capital categories.
- Confirm that subledger accounting entries have transferred and posted to the GL.
- Reconcile AR, AP, inventory, and cash control accounts.
- Separate accounting movements from operational cash drivers.
- Apply consistent currency translation and intercompany eliminations.
- calculate net and operating working capital using governed formulas.
- Explain the change using aging, due dates, transaction status, and inventory detail.
Oracle provides dedicated reports for Payables invoice aging, Receivables aging by GL account, and period inventory valuation. These reports help connect the balance-sheet total with the transactions and timing behind it.
Be careful when comparing Oracle AP reports. Oracle documents that an aging subject area may include unaccounted invoices, while liability reporting can be limited to accounted invoices. If scope and accounting status differ, two valid reports can produce different totals.
For a broader view of available reporting approaches, see this guide to Oracle Fusion reporting tools.
How Do You Calculate Working Capital from SAP?
The same calculation applies in SAP: map current G/L accounts, reconcile subsidiary records, and analyze open items and inventory beneath the reported balances.
A typical SAP working-capital model draws from:
- The Financial Statement Version and G/L for current-asset and current-liability balances
- Customer open items and aging for receivables
- Vendor open items, due dates, and payment terms for payables
- Inventory and material valuation records
- Company code, profit center, cost center, segment, and trading-partner dimensions
- Currency, consolidation, and intercompany data
The exact extraction design will differ between SAP ECC, SAP S/4HANA, and warehouse or analytics environments. Finance should preserve the relationship between the G/L control account and the underlying customer, supplier, or material record.
SAP also publishes a working-capital dashboard model that organizes analysis around accounts receivable, accounts payable, and inventory.
Regardless of platform, the calculation should use an approved account map and reconcile to the financial statements before operational ratios are added.
What Should a Weekly Working Capital Dashboard Show?
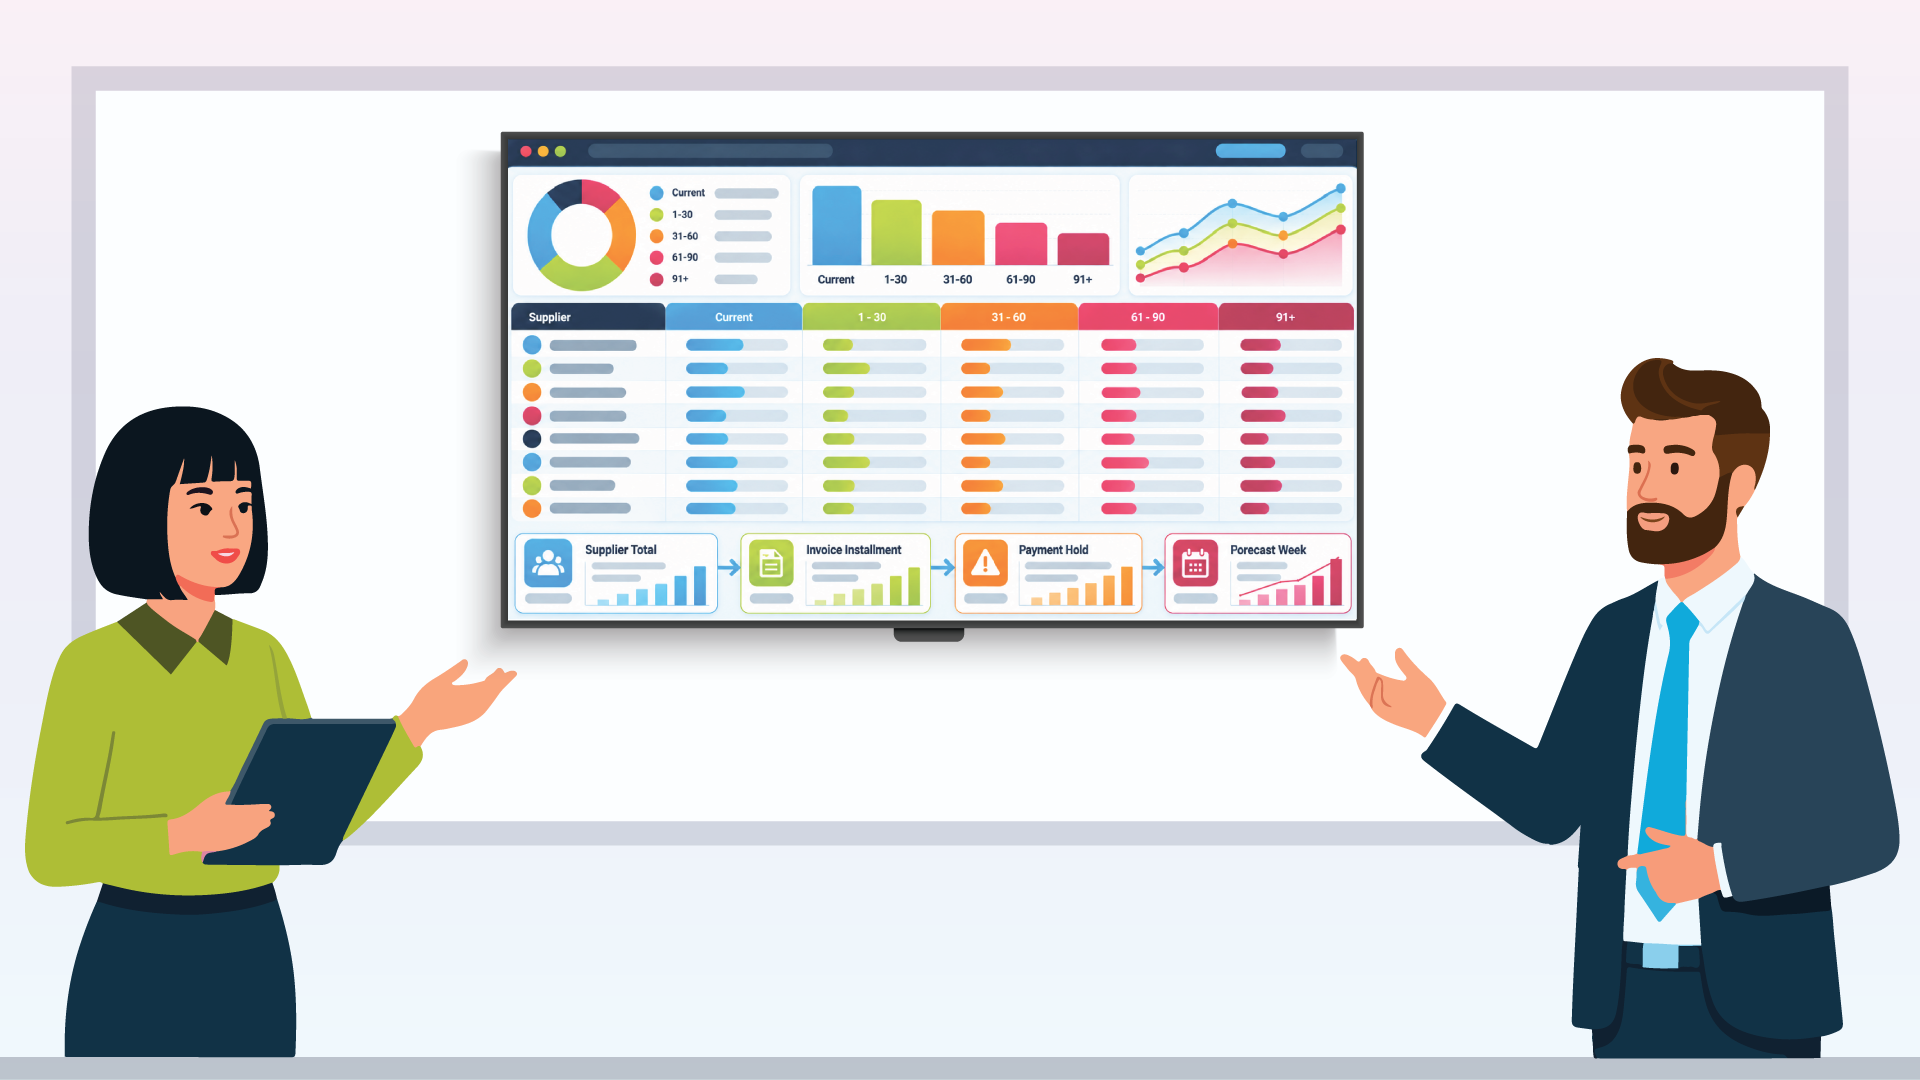
A useful working-capital dashboard connects the reported balance with the operational events that changed it. It should show position, movement, timing, exceptions, and transaction-level evidence.
| Dashboard Layer | Measures and Views | Question Answered |
|---|---|---|
| Executive position | Net working capital, operating working capital, current ratio, change in OWC, cash conversion cycle | What is the current position? |
| Component analysis | Cash, receivables, inventory, payables, accruals, and other balances | Where is cash committed? |
| Timing | DSO, DIO, DPO, aging buckets, overdue percentage, and payment terms | How quickly is cash moving? |
| Exceptions | Disputed invoices, blocked payments, unapplied cash, slow-moving inventory, and unreconciled balances | What needs action? |
| Forecast | Expected collections, supplier payments, inventory requirements, and scenario assumptions | What is likely to happen next? |
| Traceability | Entity, GL account, customer, supplier, item, invoice, journal, and source transaction | Can the number be explained? |
A weekly waterfall can translate balance movements into cash impact:
| Movement | Change | Cash Effect |
|---|---|---|
| Opening operating working capital | $2,700,000 | |
| Increase in receivables | +$350,000 | Cash use |
| Increase in inventory | +$250,000 | Cash use |
| Increase in payables | −$150,000 | Cash source |
| Increase in operating accruals | −$50,000 | Cash source |
| Other operating movements | +$100,000 | Cash use |
| Closing operating working capital | $3,200,000 | Net cash use of $500,000 |
The dashboard should let a Treasurer move from the $500,000 cash use to the customers, invoices, inventory categories, suppliers, and entities responsible for it.
Weekly monitoring works for many organizations. Companies with tight liquidity, volatile sales, or high transaction volumes may need daily exception monitoring. Monthly reporting remains important for formal close and board reporting, but it is often too late for operational intervention.
What Does Good Working Capital Look Like?
Good working capital means the company can meet its obligations while avoiding unnecessary cash commitment. It is not a universal dollar amount or current ratio.
The appropriate position depends on:
- Industry and business model
- Revenue and purchasing seasonality
- Customer and supplier payment terms
- Inventory lead times and obsolescence risk
- Access to credit and available cash
- Growth rate and acquisition activity
- Historical volatility
- Quality and collectability of current assets
Negative working capital is not automatically unhealthy. Retailers and subscription businesses may collect cash before paying suppliers or recognizing all related revenue. Conversely, positive working capital can conceal overdue receivables and obsolete inventory.
Evaluate the trend, aging profile, conversion cycle, forecast, and liquidity buffer together. Industry medians can provide context, but they should not replace company-specific analysis.
How SplashBI Connects Working Capital Data
A working-capital calculation loses value when the GL total, aging reports, inventory data, and cash forecast are maintained in separate exports.
SplashBI Financial Analytics helps Oracle finance teams combine financial and operational reporting across Oracle E-Business Suite, Fusion Cloud ERP, and Oracle EPM. Its documented finance capabilities include AP aging and payment timing, AR aging and DSO, cash-flow analysis, multi-entity reporting, and drilldown from financial balances to supporting detail.
Teams can use those governed data sets to configure a working-capital dashboard that brings together:
- Reconciled GL balances
- Customer invoices, receipts, disputes, and aging
- Supplier invoices, due dates, holds, and payment timing
- Inventory valuation, aging, availability, and slow-moving stock
- Entity, currency, account, and organizational hierarchies
- Weekly movement and cash-impact analysis
SplashBI also offers Oracle supply-chain reporting for inventory on-hand, valuation, aging, shortages, excess inventory, and related operational measures.
For finance teams that prefer Excel, GL Connect supports connected Oracle reporting with refreshable templates and drilldown from GL balances to journal and subledger detail. SplashBI describes Fusion Cloud access as near real time and EBS reporting as real time, so data-freshness expectations should be set according to the source architecture.
Role-based access, governed definitions, controlled distribution, and traceability remain important because working-capital reports can expose customer, supplier, cash, and entity-level information. The objective is not simply to assemble another dashboard. It is to create a repeatable management view that reconciles to Finance and still provides the detail required for action.
Explore SplashBI’s Oracle Cloud reporting capabilities or review this guide to the statement of cash flows to connect working-capital movements with broader cash reporting.
Turn a Balance-Sheet Number Into a Cash Decision
Calculating working capital takes one subtraction. Managing it requires reconciled balances, consistent classifications, aging analysis, operational ownership, and a clear path to supporting transactions.
Start with the GL, explain the number through the subledgers, and monitor the cash impact through DSO, DIO, DPO, and a weekly working-capital waterfall. That combination turns a static balance-sheet figure into an actionable view of liquidity.

The SplashBI Editorial team covers enterprise analytics, AI-driven decision-making, and the future of Finance and HR intelligence.
Frequently Asked Questions
What is the formula for calculating working capital?
Working capital equals current assets minus current liabilities. If current assets are $10 million and current liabilities are $7 million, working capital is $3 million. Finance teams may also calculate operating working capital by excluding cash, short-term debt, and other financing-related balances.
Which accounts are included in working capital?
Working capital generally includes cash, short-term investments, receivables, inventory, prepayments, payables, accruals, current debt, and other balances classified as current. The exact accounts depend on the company’s chart of accounts, accounting policy, business model, and reporting purpose.
Is cash included in working capital?
Cash is usually included in reported net working capital because it is a current asset. It is commonly excluded from operating working capital because cash is the result being managed rather than an operating investment in receivables or inventory. The report should label the definition used.
What is the difference between working capital and the cash conversion cycle?
Working capital is a dollar balance calculated from current assets and current liabilities. The cash conversion cycle is a time-based operational measure calculated as DSO plus DIO minus DPO. The two measures should be reviewed together because equal balances can have very different aging and cash-flow risks.
Can negative working capital be healthy?
Yes. Negative working capital may be sustainable when a business collects from customers before paying suppliers, as can occur in retail and subscription models. It can also signal liquidity pressure. Review payment terms, aging, cash forecasts, financing access, and overdue obligations before drawing a conclusion.
How often should working capital be reviewed?
Formal working capital should be reviewed during every financial close. Treasury and operational teams should normally monitor its major drivers weekly. Organizations with constrained cash, high transaction volumes, seasonal demand, or volatile collections may need daily forecasts and exception reporting.