

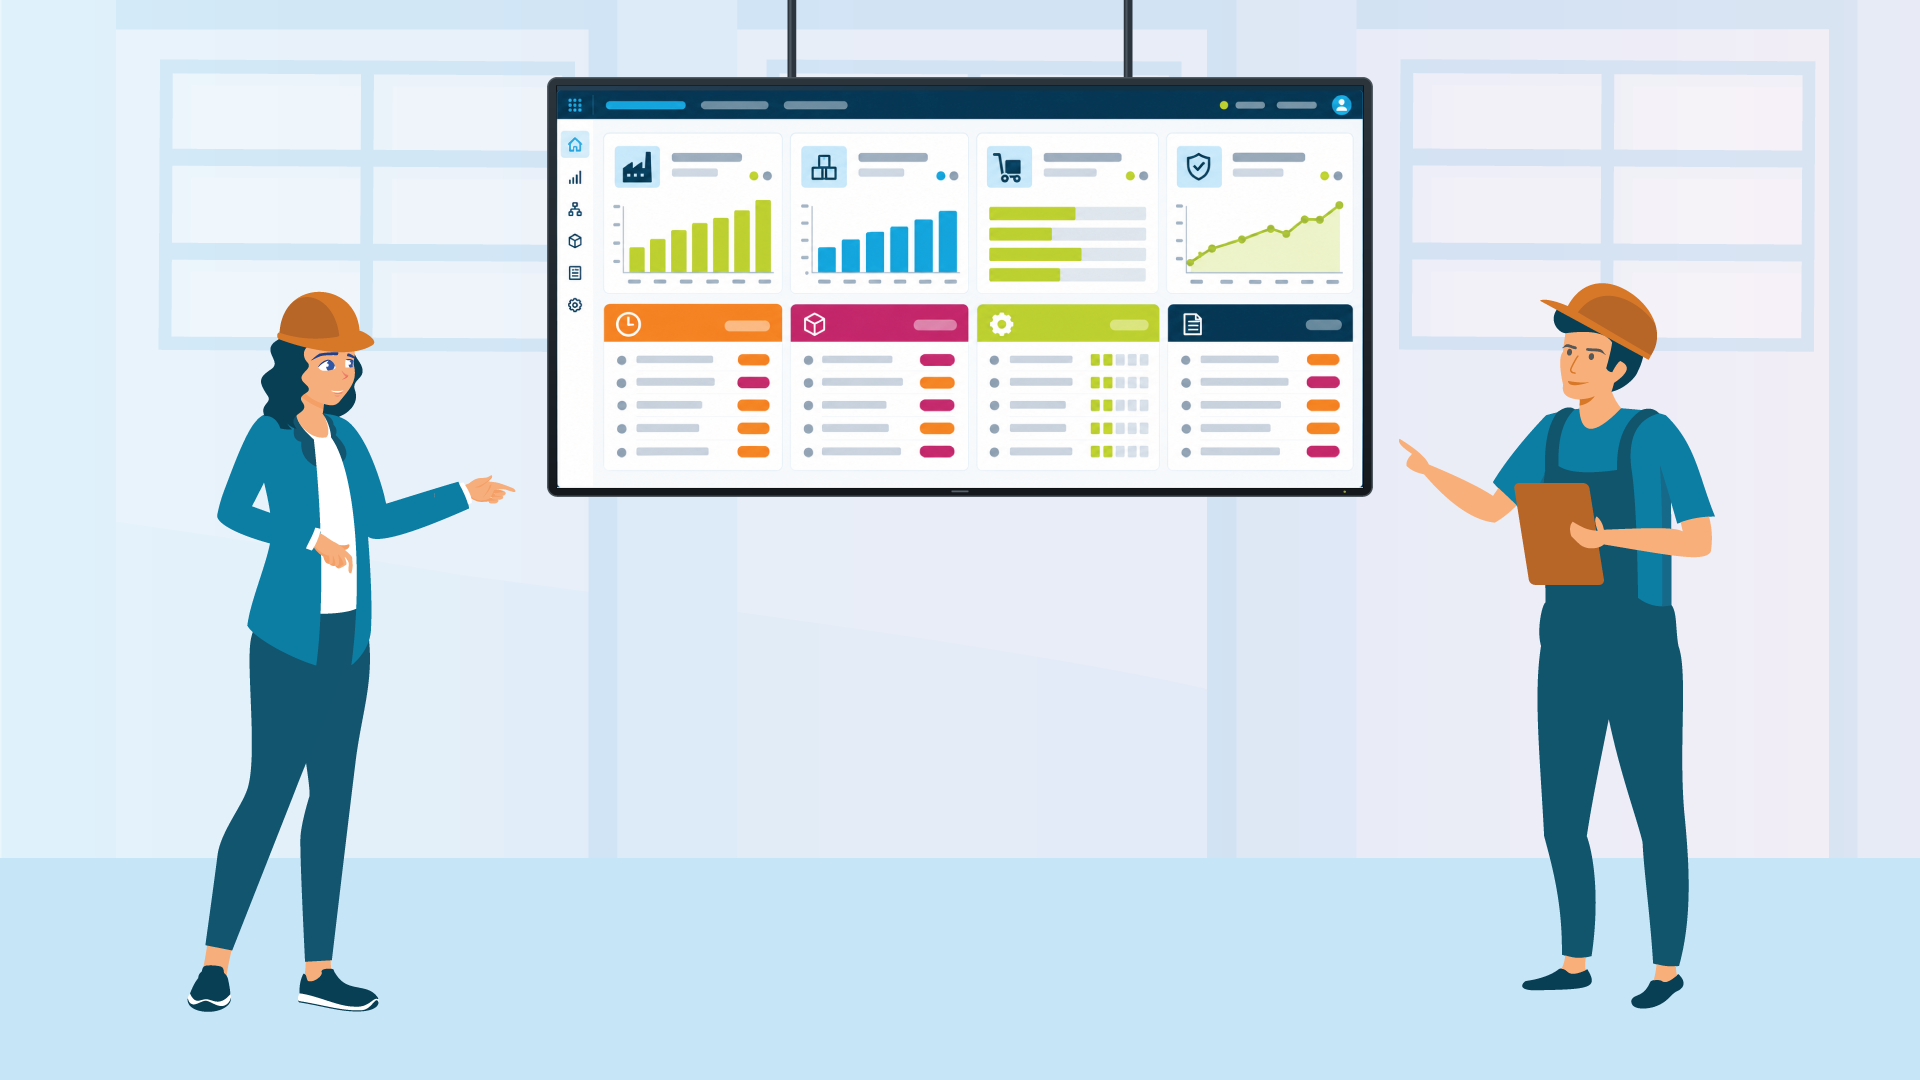
The morning production review looks reassuring.
Output is close to plan. WIP is stable. Material availability remains within tolerance. Supplier quality is above target.
Underneath, one important work order has not progressed for days. A component required tomorrow has not arrived. Supplier defects are clustering around one part. Open demand spans different bills of materials revisions. And actual manufacturing costs are creeping above plan, even as production output remains on target.
The dashboard is doing what high-level reporting is designed to do: summarizing a complex operation.
The danger is treating the summary as the conclusion. A problem can remain too small to change a plant-wide KPI while becoming increasingly expensive to solve.
Aggregate KPIs Compress the Variations That Matter
Manufacturing leaders need output, schedule attainment, OEE, inventory, and supplier KPIs. But every aggregate removes detail. Totals remove age. Averages flatten variation. Percentages can give equal weight to items with different operational consequences.
This visibility gap remains significant. In the Manufacturing Vision Study of manufacturing executives and IT and operational technology leaders, only 16% reported real-time WIP monitoring across the entire manufacturing process.
The answer is reporting that lets people move from the aggregate to the exceptions and transactions underneath it.
Five Ways Manufacturing Risk Disappears in the Summary
1. Total WIP Hides Age
Total WIP can remain stable while its composition deteriorates. New orders enter, completed orders leave and older work remains trapped at inspection, waiting for material or queued behind a constraint.
Reporting must show how long each order has been open and stationary, and whether that age fits its routing and promised date.
The problem is not only how much work is in progress. It is which work has stopped progressing.
2. Material Availability Hides Criticality
A plant can report 98% material availability and still be unable to complete a priority build.
The missing 2% may include a low-value component without which the product cannot move. Availability without scheduled work, time-to-need, and alternative supply can create confidence without readiness.
The operational question is not, “How much material is available?” It is, “Which scheduled work cannot proceed with the material available?”
3. Supplier Averages Hide Concentrated Failures
An overall supplier defect rate can remain acceptable while failures accumulate around one supplier site, component, production lot or defect category.
That concentration may trigger inspection, containment, rework, or line disruption while the aggregate measure remains green.
Supplier quality reporting becomes more useful when teams can connect a defect to the affected parts, receipts, lots, work orders, and production commitments.
4. The Current BOM Hides Revision Exposure
Bills of materials are supposed to change. Engineering improvements, substitutions, and product updates all create legitimate revisions.
Risk appears when reporting cannot show which work orders, purchases, inventory, and costs belong to each revision. A current BOM may be correct while open demand still depends on an earlier one.
Without that context, a manufacturer can buy the wrong material, create shortages for the active build, or carry inventory that no longer has a clear use.
5. Production Output Hides Manufacturing Cost Variance
A production line can meet its output target while spending more than planned to achieve it.
A bill of materials may specify five components, and the routing may allow one labor hour per unit. But if production consumes additional materials, requires extra labor hours, or involves rework, actual manufacturing costs can exceed the planned cost even when the finished unit is delivered on schedule.
Manufacturing cost variance helps reveal that gap. Looking beyond the total variance to material usage, labor hours, and rework can help manufacturers identify where costs are accumulating and investigate the underlying causes.
The question is not only, "Did we produce what we planned?" It is, "What did it actually cost us to produce it?"
The Cost Starts Accumulating Before the KPI Turns Red
| Hidden condition | Early operational signal | Cost that appears later |
|---|---|---|
| Aging work order | Excess time at one operation | Longer cycle time, trapped working capital, late delivery |
| Critical material delay | Supply date exceeds time-to-need | Schedule changes, idle capacity, premium freight |
| Concentrated supplier defect | Repeated failures for one part or lot | Inspection, containment, scrap and rework |
| BOM revision exposure | Open demand spans multiple revisions | Shortages, obsolete inventory, incorrect builds and cost variance |
| Manufacturing cost variance | Actual material consumption or labor hours exceed planned requirements | Higher unit costs, rework expenses and reduced margins |
These costs often begin while output looks healthy. Rescheduling, expediting, and manual investigation can protect the headline KPI while making the operation more expensive and less predictable.
Make Every Summary Traceable to Its Source
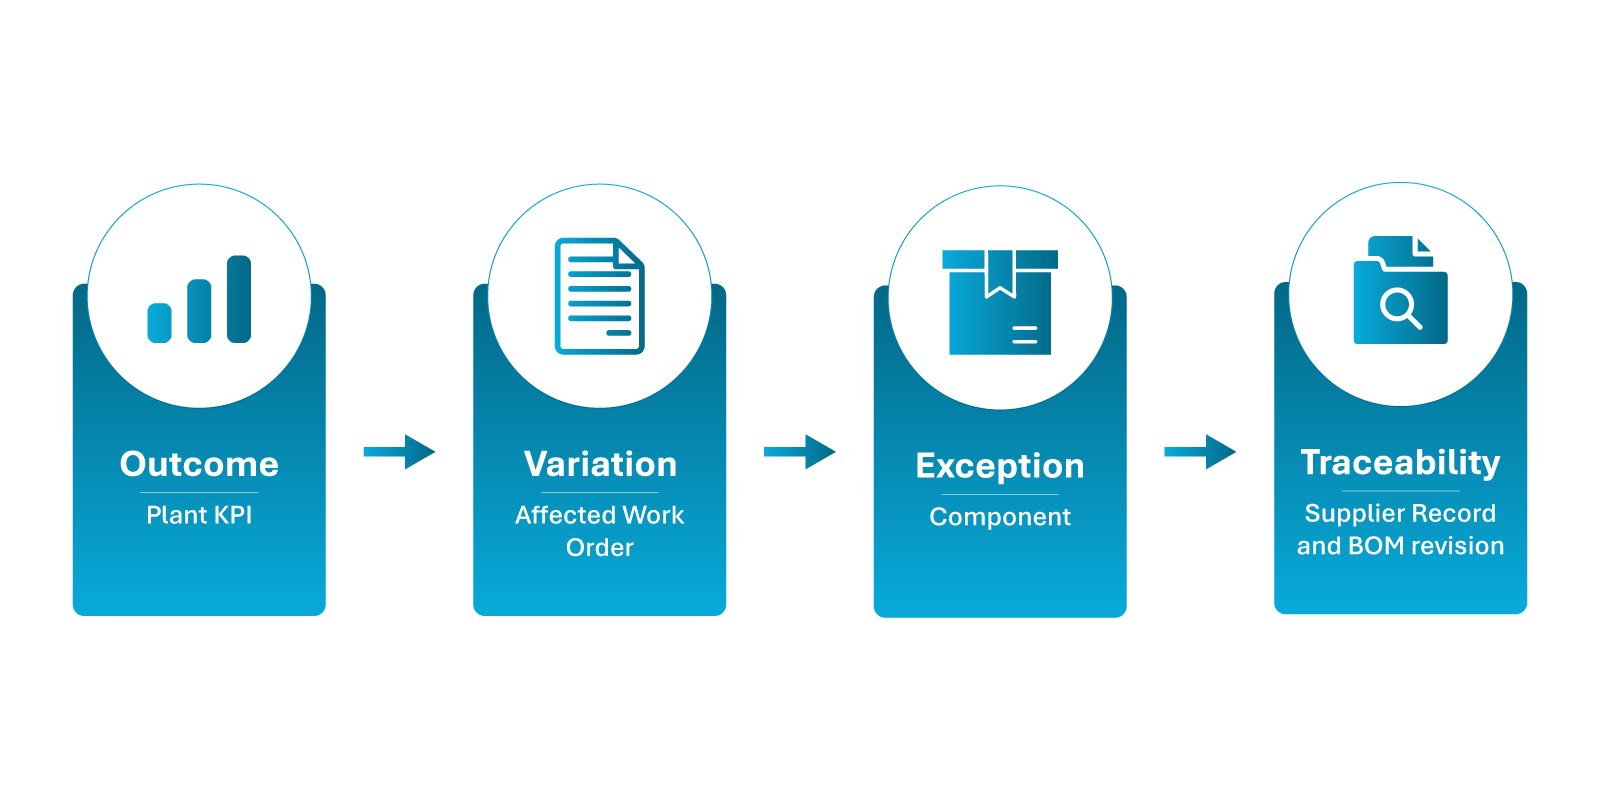
A useful manufacturing reporting model should support four levels of inquiry:
- Outcome: Is the plant meeting its operational objective?
- Variation: Which line, shift, supplier, part or order differs from the aggregate?
- Exception: Which deviation threatens production, delivery, or cost, including manufacturing cost variances that may be hidden by on-target output?
- Traceability: Which work orders, material transactions, labor records, BOM revisions, and other dependencies explain it?
This does not require a separate dashboard for every possible problem. It requires a governed path from the KPI to the operational evidence behind it.
One Reporting Path from KPI to Constraint
SplashBI Supply Chain Reporting helps manufacturing teams connect Oracle EBS, Oracle Fusion, spreadsheets and legacy data rather than investigating each source separately.
SplashBI’s AI x BI Flywheel supports the same progression:
- CONNECT: Use Data Pipeline and Data Aggregation to bring production, inventory, cost and related enterprise data into a governed reporting foundation.
- UNLOCK: Deliver operational reports, exception views, manufacturing cost variance analysis, scheduled outputs and connected Excel analysis that let authorized users investigate the work orders, materials, labor costs, and suppliers behind plant level performance.
- ASK: Use SplashAI to investigate governed data through natural-language questions and follow-ups, with the underlying logic available for verification.
Manufacturing cost variance reporting is one example of how SplashBI helps teams look beyond production output to understand where actual costs differ from planned manufacturing requirements.
A Green KPI Should Be a Doorway, But Not the Dead End
High-level manufacturing KPIs remain essential. They show whether the operation is producing the expected result, but not whether that result is becoming harder or more expensive to sustain.
That requires visibility into age, criticality, concentration, and change. It requires the ability to move from the plant average to the specific order, component, supplier, or revision that could shape the next shift, delivery, or cost result.
“Everything looks fine” should begin the investigation, not end it.
Talk to a SplashBI supply chain reporting expert about making hidden manufacturing constraints visible before they become production, delivery or cost problems.

With over three decades of experience in IT leadership, Oracle ERP solutions, and application development, Prasanna specializes in enterprise systems implementation, solution architecture, and business intelligence. He brings extensive expertise in Oracle E-Business Suite (EBS), global project management, and systems integration, with a focus on improving operational efficiency, streamlining processes, and aligning technology strategies with business goals.