

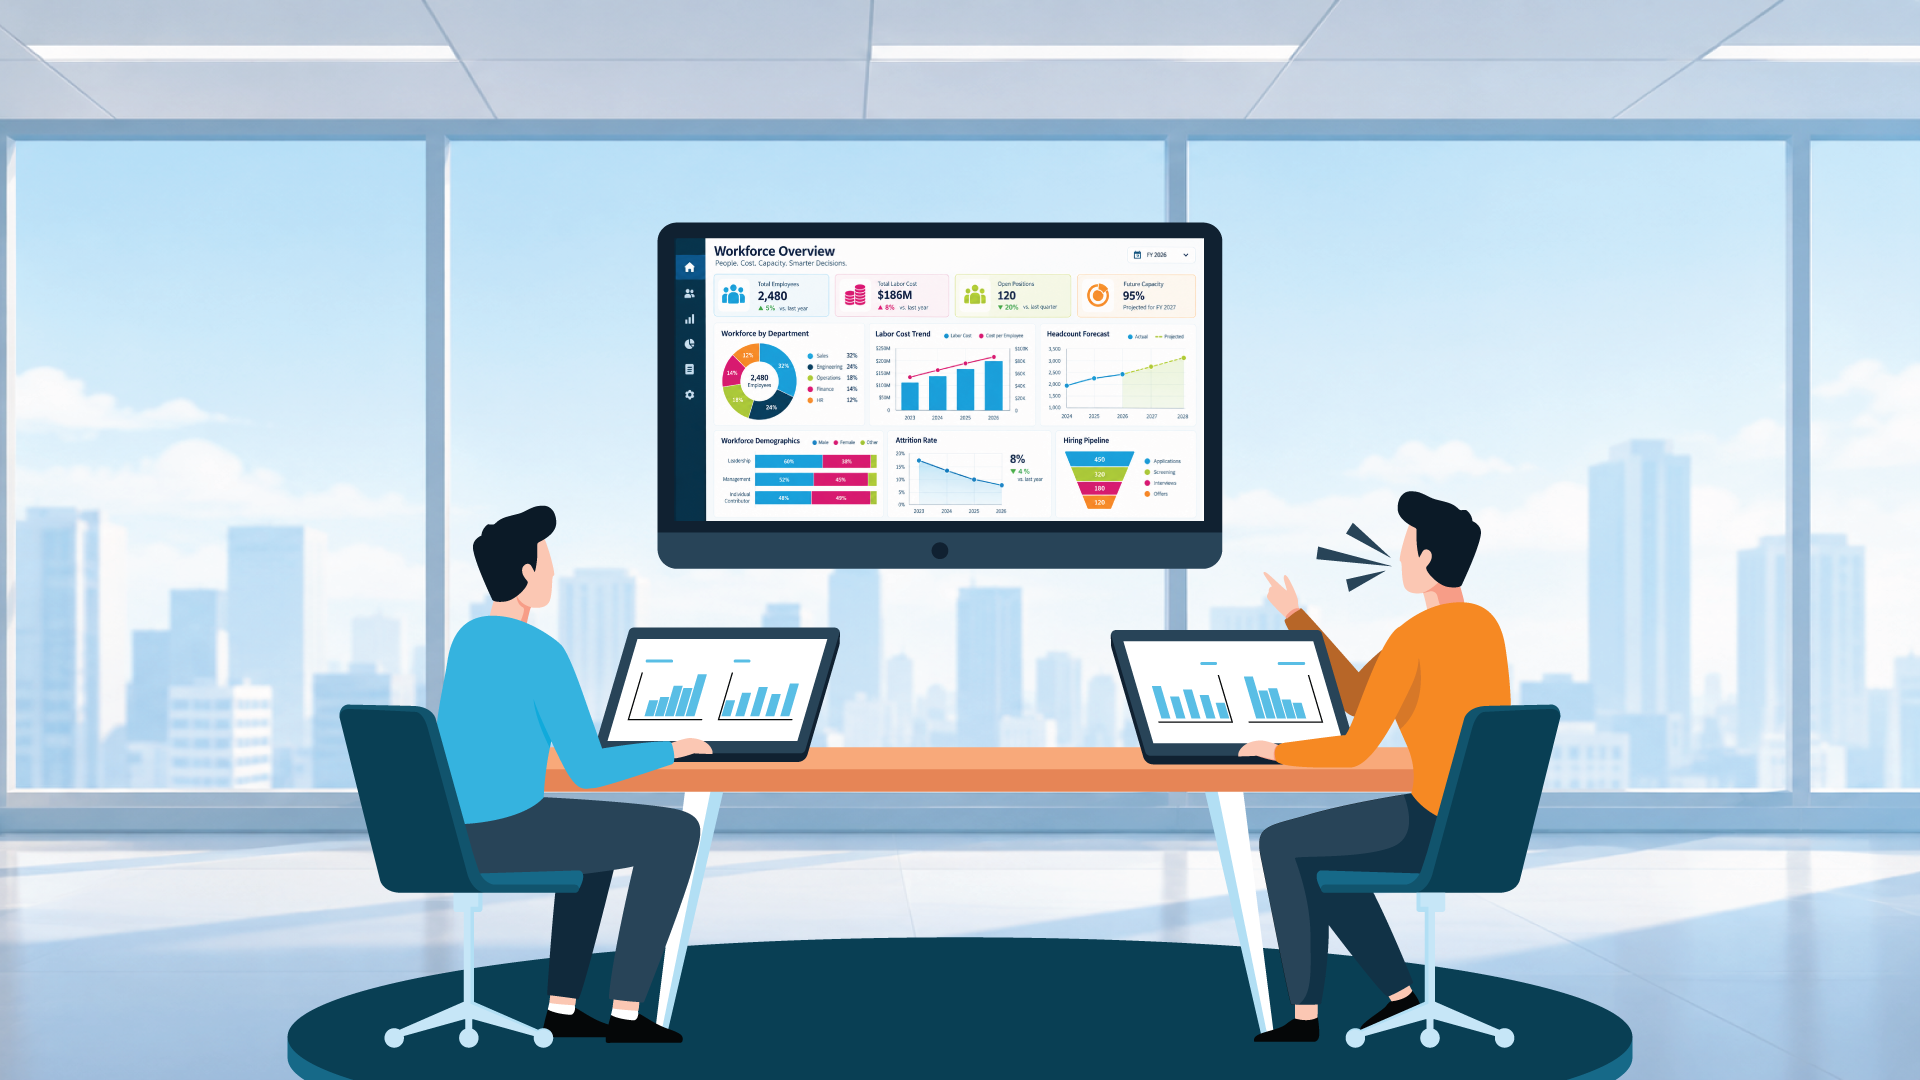
Workforce analytics is the systematic use of workforce, financial, and operational data to understand how people, skills, capacity, and labor cost affect business performance. It combines descriptive, diagnostic, predictive, and prescriptive analysis to support decisions about hiring, retention, productivity, workforce planning, organizational design, and workforce cost.
The important word is decisions. A dashboard showing headcount or turnover may describe the workforce accurately, but workforce analytics goes further. It helps leaders understand why a result changed, what it means financially, what may happen next, and which response deserves consideration.
What Is Workforce Analytics?
Workforce analytics is the process of collecting, integrating, and analyzing workforce data to improve organizational decisions. It examines not only employees, but also positions, assignments, skills, vacancies, contingent workers, labor costs, and the business outcomes those resources support.
The data may come from an HR information system, applicant tracking system, payroll platform, time and attendance application, learning system, engagement survey, ERP, or planning tool. Bringing those sources together helps answer questions such as:
- Which roles are experiencing preventable turnover?
- Where will staffing fall short of planned demand?
- Is overtime increasing because of vacancies, scheduling, or workload?
- Which recruiting sources produce employees who stay and perform?
- How will a hiring freeze affect capacity and labor cost?
Workforce reporting and workforce analytics are related, but they are not identical. Reporting organizes known measures and establishes what happened. Workforce data analytics uses comparisons, relationships, forecasts, and scenarios to explain a result or inform an action. A well-designed people analytics dashboard can support both.
Workforce Analytics vs. People Analytics, HR Analytics, and Workforce Management Analytics
Workforce analytics overlaps with people analytics, HR analytics, and workforce management analytics, but each term emphasizes a different analytical scope. Organizations do not use these labels consistently, so the underlying questions matter more than the name.
| Term | Primary Focus | Typical Question |
|---|---|---|
| Workforce analytics | Workforce composition, movement, capacity, cost, and performance | Do we have the people, skills, and budget required to execute the business plan? |
| People analytics | Employee behavior, experience, performance, and organizational outcomes | What improves engagement, retention, mobility, or performance? |
| HR analytics | The effectiveness and efficiency of HR programs and processes | How well are recruiting, learning, compensation, and HR service delivery working? |
| Workforce management analytics | Scheduling, attendance, staffing, and labor deployment | Are the right workers scheduled at the right time and cost? |
In practice, workforce analytics and people analytics are often used interchangeably. Workforce analytics is usually the clearer term when the work includes labor cost, capacity, contingent labor, or Finance data. HR analytics is often narrower and centered on the HR function.
Organizations evaluating technology rather than the discipline can use a separate people analytics software guide to compare data connectivity, packaged metrics, governance, AI capabilities, and implementation effort.
What Are the Four Types of Workforce Analytics?
The four main types are descriptive, diagnostic, predictive, and prescriptive analytics. They answer different questions and are most useful when applied together rather than treated as isolated stages.
| Type | Core Question | Workforce Example | Typical Output |
|---|---|---|---|
| Descriptive | What happened? | Voluntary turnover increased in critical engineering roles | Trend, scorecard, or cohort table |
| Diagnostic | Why did it happen? | Exits were concentrated among new hires in two locations and one job family | Driver analysis, comparison, or drilldown |
| Predictive | What may happen next? | Planned hiring may not close a forecast capacity gap next quarter | Forecast, probability, or risk band |
| Prescriptive | Which options should be considered? | Compare hiring, reskilling, contractor, and redeployment scenarios | Scenario comparison or recommended action for review |
Descriptive analytics establishes a trustworthy baseline. Diagnostic analytics examines relationships and possible drivers. Predictive analytics uses historical patterns and assumptions to estimate future outcomes. Prescriptive analytics evaluates potential responses, sometimes using optimization or AI.
These methods have limits. A correlation between manager changes and turnover does not prove that the manager change caused the exits. A flight-risk score does not establish that a particular employee will resign. Models should make uncertainty visible and support human judgment, not disguise estimates as facts.
Which Metrics Belong in the Workforce Analytics Metric Stack?
The right metrics depend on the decision, but a useful workforce analytics program connects three layers: operational activity, financial impact, and future workforce capacity. This Workforce Analytics Metric Stack prevents teams from measuring HR activity without showing what it costs or what it means for the plan.
| Metric Layer | Questions | Representative Metrics | Main Data Sources |
|---|---|---|---|
| Operational | What is happening across the workforce? | Headcount, FTE, hires, exits, vacancy rate, time to fill, absence, overtime, span of control, contingent-worker mix | HCM, ATS, payroll, time, learning |
| Financial | What does the workforce cost, and how does it compare with plan and output? | Total workforce cost, cost per FTE, labor cost as a percentage of revenue, compensation against budget, overtime cost, contractor spend, vacancy cost | HCM, payroll, GL, planning, revenue data |
| Predictive and Decision | What may happen, and which options should leaders evaluate? | Attrition risk, skills gaps, retirement exposure, capacity forecast, succession coverage, hiring demand, scenario impact | Historical workforce events, skills, performance, engagement, financial plans |
Operational metrics establish the workforce baseline
Headcount counts people, while FTE converts scheduled or paid work into a full-time equivalent. The difference matters with part-time workers, multiple assignments, seasonal staff, and contingent labor.
Hiring, termination, promotion, transfer, absence, and leave measures explain how the baseline changes. Turnover and attrition should be segmented by voluntary status, regretted loss, tenure, job family, location, manager, or critical role. One enterprise-wide percentage can conceal a serious problem in a small population.
Recruiting measures should also connect activity to outcomes. Time to fill and cost per hire matter, but source quality, offer acceptance, first-year retention, and post-hire performance provide a fuller view. See these recruiting metrics in more detail.
Financial metrics connect HR and Finance
Workforce cost extends beyond base salary and may include incentives, employer taxes, benefits, overtime, contractors, recruiting, and training. Teams must define what is included before comparing periods or departments.
Cost per FTE, workforce-plan variance, overtime cost, contractor spend, and labor cost as a percentage of revenue give Finance and HR a common view. A vacancy may reduce salary expense while increasing overtime, contractor use, service risk, or delayed revenue elsewhere.
Predictive workforce analytics supports planning, not certainty
Predictive measures estimate future demand, workforce supply, skills coverage, vacancy exposure, or attrition risk. Prescriptive models can compare hiring, reskilling, redeployment, automation, or contingent-labor scenarios.
For skills analysis, organizations can combine their internal taxonomy with a maintained occupational reference such as the O*NET database, while preserving company-specific roles and proficiency requirements.
The quality of these measures depends on the layers underneath. Forecasts weaken when FTE definitions, termination reasons, or Finance mappings are inconsistent.
Benchmarks require similar care. Turnover and time-to-fill results vary by industry, job, geography, and methodology. Use internal baselines and approved targets first. The US Bureau of Labor Statistics Job Openings and Labor Turnover Survey provides external US labor-market context, not a company-specific target.
What Are Practical Workforce Analytics Examples?
Practical workforce analytics begins with a decision that someone owns. The analysis then combines the data needed to make that decision more informed, timely, and measurable.
| Business Question | Data Combined | Analytical Level | Decision Supported |
|---|---|---|---|
| Where is regretted attrition increasing? | Terminations, role criticality, tenure, manager, compensation | Descriptive and diagnostic | Prioritize deeper review and retention action |
| Can the current workforce support next year's plan? | Headcount, skills, vacancies, demand forecast, labor budget | Predictive | Hire, reskill, redeploy, or sequence work differently |
| Which recruiting sources produce durable hires? | ATS source, hiring stage, performance, first-year retention | Diagnostic | Reallocate recruiting investment |
| Why is labor cost above plan? | Payroll, overtime, contractors, vacancies, GL, budget | Diagnostic | Correct assumptions or change staffing choices |
| What is the likely impact of a reorganization? | Positions, hierarchy, compensation, skills, cost centers | Predictive and prescriptive | Compare organizational scenarios before approval |
Consider a healthcare organization experiencing higher nurse turnover. A basic report shows the exit rate. Workforce analytics can compare turnover by tenure, shift, facility, manager, overtime, absence, compensation, and vacancy pressure. Finance can then estimate replacement and overtime implications, while HR assigns an intervention owner and measures whether the chosen response changes the outcome.
The analysis does not make the employment decision. It creates a better evidence base, identifies uncertainty, and provides a result that can be monitored after action is taken.
How Does Workforce Analytics Work Across Oracle, Workday, and SAP?
Cross-system workforce analytics translates different HCM structures into governed workforce concepts. It must preserve history and make person, assignment, position, organization, event, and cost definitions comparable.
| Workforce Concept | Oracle HCM Source Family | Workday Source Family | SAP SuccessFactors Source Family | Normalization Question |
|---|---|---|---|---|
| Worker and employment status | Person, work relationships, assignment | Worker, position, job | User, employment, job information | Who counts as active on a specific date? |
| Organization and cost | Legal employer, business unit, department, cost center | Company, supervisory organization, cost center | Legal entity, business unit, department, cost center | Which hierarchy is authoritative for the analysis? |
| Workforce movement | Hire, transfer, promotion, and termination actions | Staffing events and business processes | Job and employment events | Which events count as hires, exits, and internal moves? |
| Capacity | Assignment status, hours, and FTE | Scheduled hours, time type, and FTE | Standard hours, employment percentage, and FTE | How are worker, position, headcount, and FTE distinguished? |
| Talent and skills | Recruiting, performance, learning, talent profiles | Recruiting, performance, learning, skills | Recruiting, performance, learning, talent intelligence | Are skills and rating scales comparable? |
This is a conceptual map, not a universal field specification. Oracle E-Business Suite HR and Fusion Cloud HCM differ, and every HCM estate can include custom actions, fields, organizations, and integrations. Use official Oracle Cloud HCM documentation and SAP SuccessFactors documentation alongside the organization's configuration records.
Four modeling choices have an outsized effect on accuracy:
- Analytical grain: A person may hold multiple assignments or positions. Counting the wrong object can overstate headcount.
- Effective dating: A current-state extract cannot reliably reconstruct prior reporting lines, compensation, status, or organization membership.
- Event classification: Hire, rehire, transfer, promotion, leave, contingent conversion, and termination events need agreed rules.
- Cross-domain mapping: HR organizations, Finance cost centers, payroll entities, and planning hierarchies must be reconciled before workforce cost can be trusted.
A governed semantic layer can centralize these definitions so dashboards, scheduled reports, analysts, and AI experiences do not calculate the same metric differently.
How Do You Build a Workforce Analytics Practice?
Build workforce analytics around a recurring business decision, then add the definitions, data, controls, and delivery method required to support it. Starting with every available field usually creates a large data project without a clear owner or outcome.
| Step | Activity | Output |
|---|---|---|
| 1. Define the decision | Identify the action, accountable leader, timing, and business consequence | Prioritized decision statement |
| 2. Define the measures | Agree on population, formula, time basis, dimensions, exclusions, and owner | Governed metric specification |
| 3. Map the sources | Identify HCM, ATS, payroll, time, Finance, survey, and planning data | Source and history inventory |
| 4. Build the model | Normalize identities, events, hierarchies, effective dates, and cross-domain keys | Reusable workforce data model |
| 5. Validate and secure | Reconcile totals and apply role, row, and sensitive-field controls | Approved, access-controlled dataset |
| 6. Deliver the analysis | Publish dashboards, reports, alerts, scenarios, or conversational access | Decision-ready analytical experience |
| 7. Act and measure | Assign an intervention owner and compare subsequent results | Documented action and feedback loop |
Begin with a manageable use case such as critical-role turnover, workforce cost against plan, or recruiting-source quality. Establish the metric and its owner, validate it against known reports, and then expand to related questions. This creates reusable analytical foundations without requiring every workforce domain to be perfect before the first decision improves.
How Do Security and Governance Apply to Workforce Analytics?
Workforce analytics requires stricter governance than an ordinary operational dashboard because it may include compensation, performance, absence, demographic, health, or predictive data. Access should reflect a person's role and legitimate business purpose, not merely their ability to open the analytics tool.
Important controls include:
- Role-based, row-level, and relevant field-level access
- Minimum cohort sizes or suppression rules for sensitive groups
- Approved metric definitions, owners, and change history
- Visible data lineage and refresh timestamps
- Audit logs for access and administrative changes
- Retention rules that reflect jurisdiction and data purpose
- Testing for bias, drift, and inappropriate proxy variables
- Human review before consequential employment action
Predictive systems need particular care. A model may identify patterns, but it can also reproduce historical bias or assign significance to incomplete data. The NIST AI Risk Management Framework provides a useful structure for governing AI risks throughout design, deployment, measurement, and monitoring.
How SplashBI Operationalizes Multi-System Workforce Analytics
A workforce analytics strategy can be sound and still take too long to operationalize when every metric requires a new extract, source-system mapping, security design, and dashboard build.
SplashBI Workforce Intelligence combines packaged workforce content, multi-system connectivity, cross-domain analysis, security, and governed AI. SplashBI states that the solution is live across more than 2.3 million employees.
Pre-built content without starting over
SplashBI documents more than 800 HR KPIs and 30+ dashboards covering workforce composition, turnover, recruiting, compensation, diversity, performance, payroll, and labor cost. The company states that the dashboards can be deployed in under four weeks and then adapted to the organization's definitions, hierarchies, thresholds, and views.
Connectivity for the HCM estate you have
More than 100 pre-built HCM connectors support systems including Oracle HCM Cloud and Fusion, Workday, SAP SuccessFactors, UKG, Ceridian Dayforce, iCIMS, and Cornerstone OnDemand. Custom pipelines and CSV ingestion can incorporate additional sources without requiring organizations to replace their existing systems.
HR and Finance in one analytical view
SplashBI connects headcount, hiring, compensation, payroll, and organizational data with budgets and financial results. This supports questions about cost per FTE, workforce-plan variance, overtime, contractor spend, and the financial impact of staffing decisions. SplashBI reports that 25 to 30 percent of its customers use HR and Finance together, giving both functions a shared analytical basis instead of competing spreadsheets.
Security and deployment choices
SplashBI states that Workforce Intelligence inherits native HCM security, applies role-based access controls, and supports cloud and on-premises deployment. These capabilities help organizations deliver different views to executives, HR leaders, HRBPs, managers, and analysts while protecting employee-level information.
AI after the data foundation
SplashAI supports natural-language questions and configurable alerts against governed enterprise data. Leaders can explore workforce patterns without treating a generic AI model as a substitute for approved metrics, security, or analytical review.
The approach can be summarized as CONNECT, UNLOCK, and ASK: connect workforce, recruiting, payroll, Finance, and operational data; unlock it through governed models and packaged analytics; then ask questions through SplashAI. Each new question can inform the next analysis, creating an AI BI Flywheel grounded in shared enterprise context.
Turn Workforce Data Into a Decision System
Workforce analytics should do more than document how many people an organization employs. It should connect workforce movement, labor cost, skills, and capacity to the decisions leaders need to make next.
The strongest programs begin with governed operational measures, connect them to Finance and business outcomes, and add prediction only when the underlying data can support it. Explore how SplashBI Workforce Intelligence brings that model together across enterprise HCM systems.

The SplashBI Editorial team covers enterprise analytics, AI-driven decision-making, and the future of Finance and HR intelligence.
Frequently Asked Questions
What is workforce analytics?
Workforce analytics is the use of workforce, financial, and operational data to understand workforce composition, movement, capacity, cost, and performance. It helps organizations describe what happened, investigate possible drivers, forecast future needs, and compare actions related to hiring, retention, skills, organizational design, and workforce planning.
What are the four types of workforce analytics?
The four types are descriptive, diagnostic, predictive, and prescriptive analytics. Descriptive analytics shows what happened. Diagnostic analytics examines why it may have happened. Predictive analytics estimates what could happen next. Prescriptive analytics compares possible responses and supports an informed decision.
Which workforce analytics metrics should HR track?
The right metrics depend on the decision. Common measures include headcount, FTE, turnover, regretted attrition, time to fill, absence, span of control, workforce cost, cost per FTE, budget variance, internal mobility, succession coverage, skills gaps, and forecast capacity.
What is the difference between workforce analytics and people analytics?
The terms often overlap. People analytics usually emphasizes employee experience, behavior, performance, and organizational outcomes. Workforce analytics often extends further into workforce supply, positions, contingent labor, operational capacity, financial planning, and labor cost. Organizations should clarify scope instead of assuming the labels have universal definitions.
What data is needed for workforce analytics?
The required data depends on the question. Common sources include HCM or HRIS records, recruiting, payroll, time and attendance, learning, performance, engagement, skills, Finance, and workforce plans. Reliable analysis also needs historical events, consistent identifiers, mapped hierarchies, documented definitions, and appropriate access controls.
Can workforce analytics predict employee turnover?
Workforce analytics can estimate turnover risk using historical patterns and relevant workforce signals. It cannot determine with certainty whether a particular employee will leave. Predictions should be validated, monitored for bias and drift, restricted to appropriate users, and used as decision support rather than automatic employment decisions.