Empowering
sales with
CRM Analytics.

Drive growth and boost your team’s confidence with actionable, real-time Salesforce Analytics.
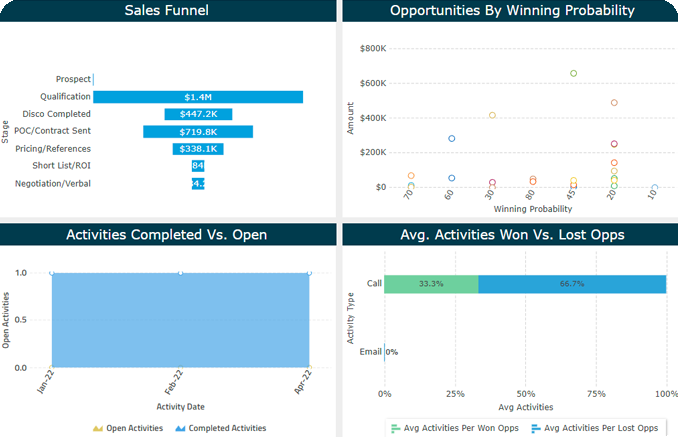
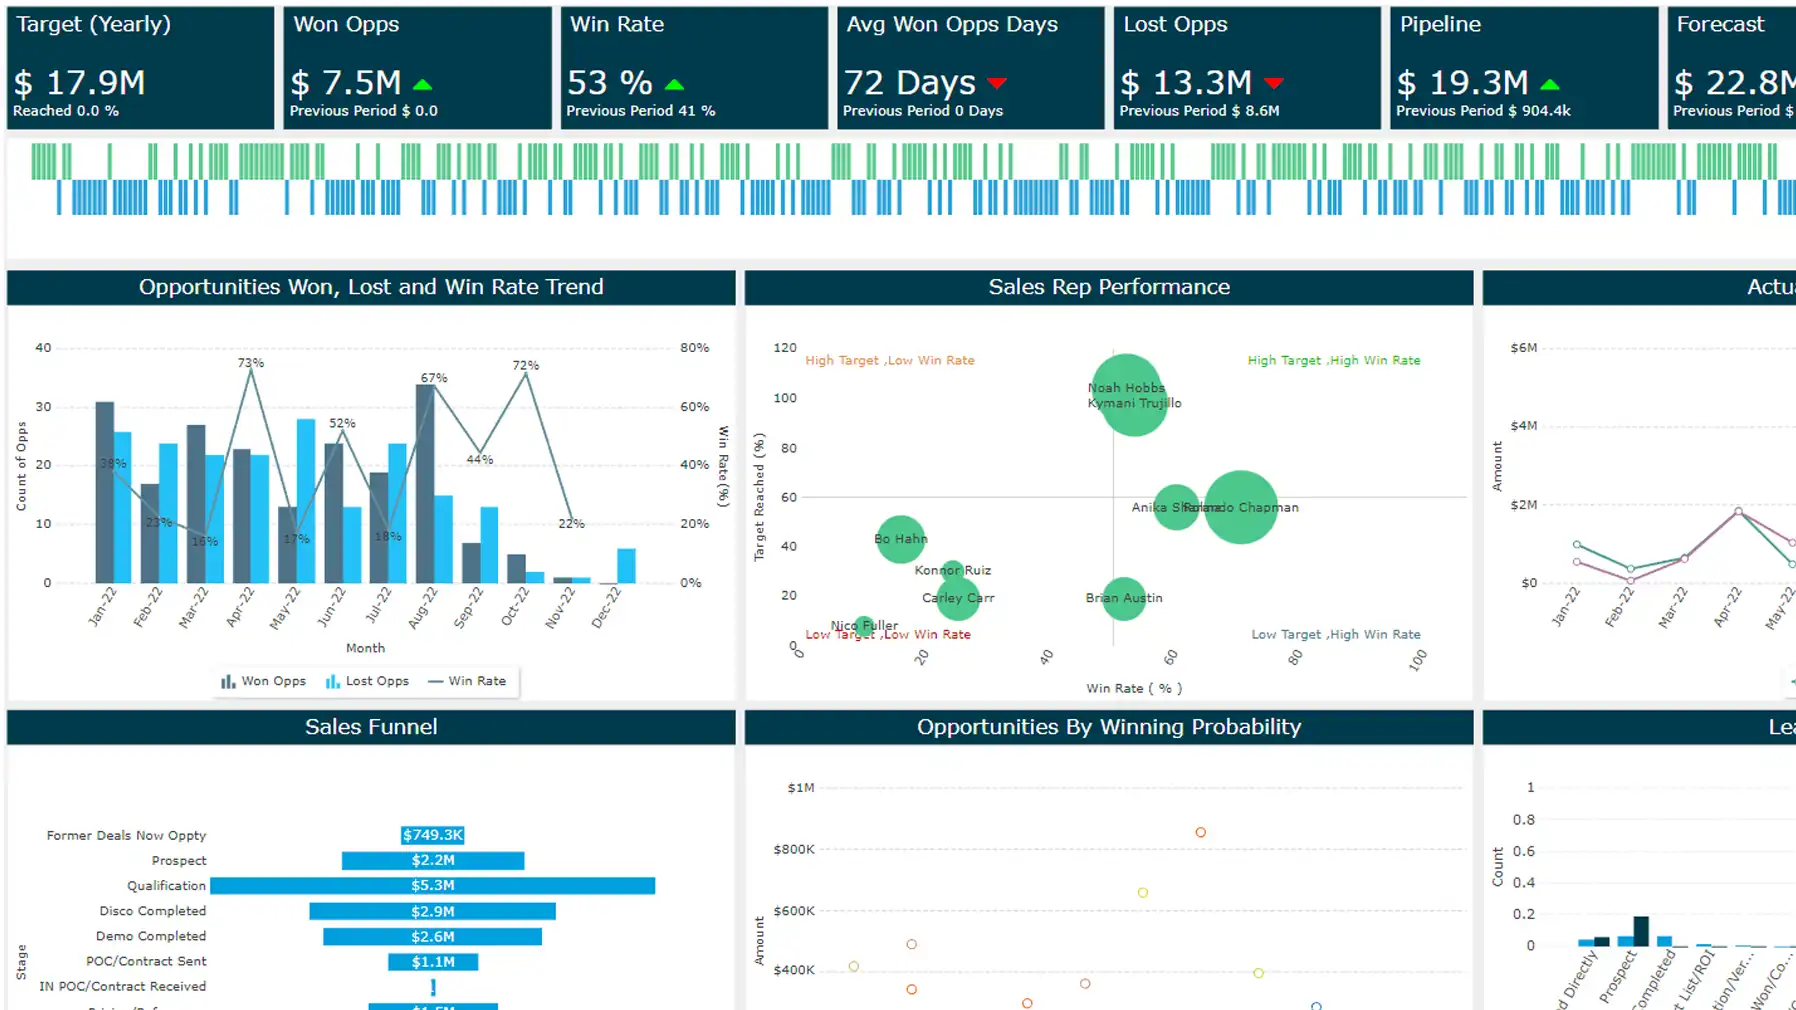
Whether you need to enable your sales reps, provide visibility for your executive team or make data-driven decisions, SplashCRM has pre-built sales reports and dashboards to help. Spend less time building reports and more time driving growth with a solution built specifically around your needs.
Stop Second Guessing Your Decisions
Arm your team with modern tools
Leveraging technology can elevate your sales dashboards, optimize your sales strategies, and provide transparency and control over your sales process. The use of the right solution impacts the entirety of your sales process—guiding salespeople through their day to complete sales activities according to best practices, which, in turn, drives revenue.
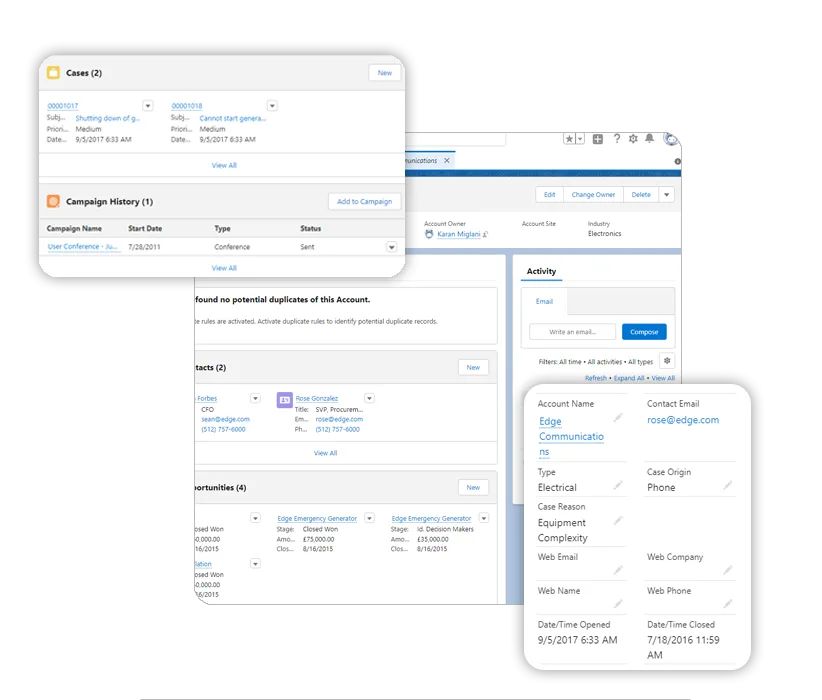
Salesforce Deep-Linking
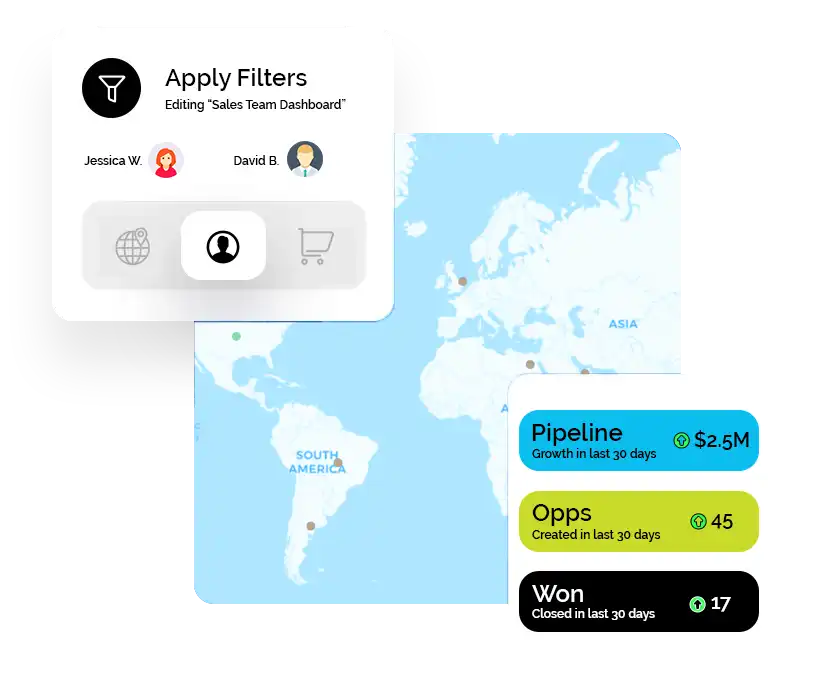
Go beyond the surface layer of your dashboard and drill down in to the data. If you drill down far enough you can even open individual contact/lead/accounts directly into Salesforce!
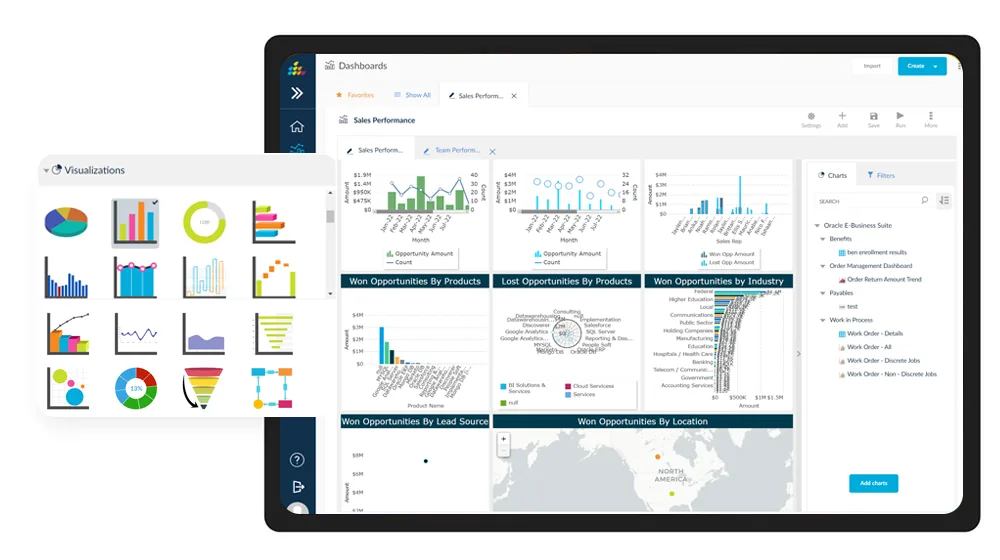
Drag & Drop Builder
Create your own reports and dashboards with ease using the intuitive drag & drop builder.
Distribution & Scheduling
Share your report or dashboard with others in either excel, PDF, or HTML format.
Cross Object
Create cross-object reports or KPIs and dive deeper in to your data.
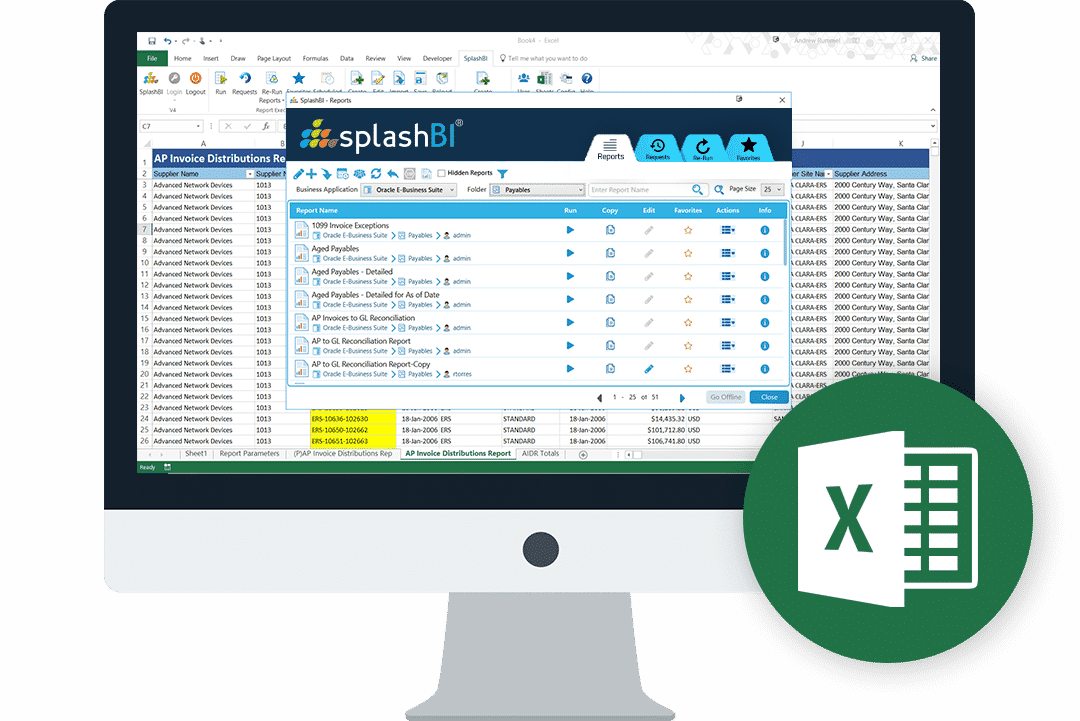
Excel Plugin
SplashBI provides a Microsoft Excel add-in for transactional reporting that is simple to install and requires no IT staff maintenance.
Powerful Sales Dashboards for Better Insights
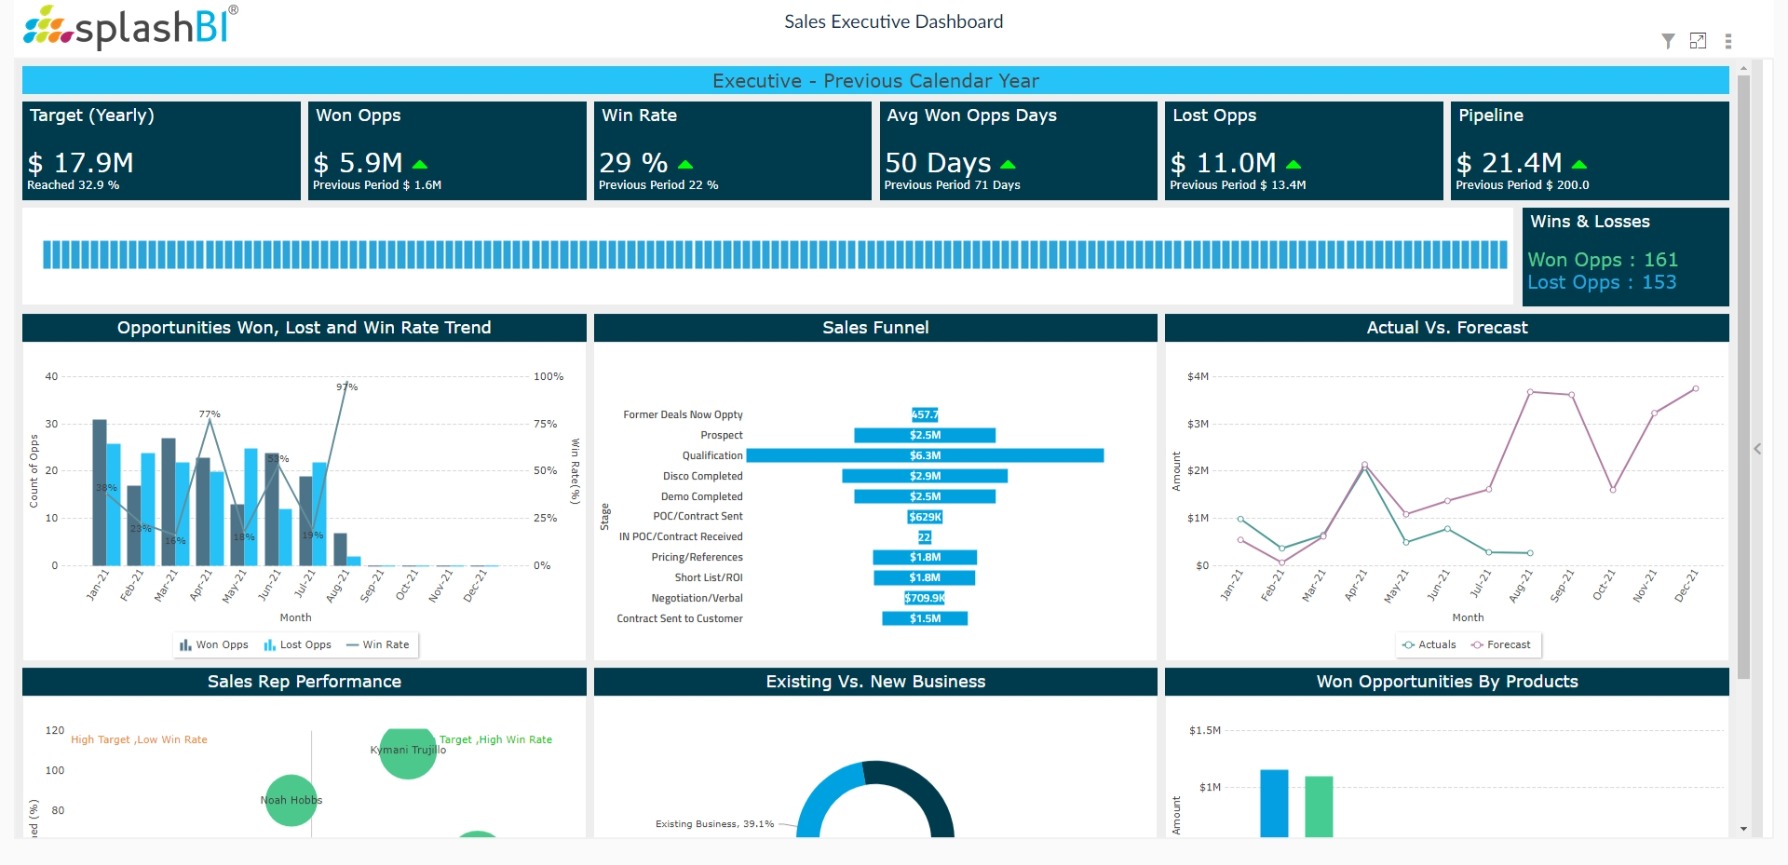
Sales dashboards are most effective when they’re thoughtfully created, contain relevant metrics, and are paired with the right technology. SplashCRM makes it easy to create dashboards that helps sales executives, managers, and reps gain actionable insights at a glance. Learn how SplashCRM can empower your sales teams with intuitive, extensive dashboards that offer full transparency into your valuable sales data.
Frequently asked questions
Why not use Saleforce's native reports & dashboards?
Salesforce reports have been a regular source of consternation among sales reps for as long as the customer relationship management software has been in use. Thousands of sales teams who utilize the software to track their sales opportunities and activities have ranted about the numerous difficulties in producing reports from their sales data. Here are five of the biggest limitations of Salesforce reports:
What do you mean by "Pre-Built" reports and dashboards?
Utilizing our unique sales analytics data model, we have created plethora of commonly used KPIs, Reports, and Dashboards. Once connected to SFDC and the data has been pulled, all of the pre-built KPIs, Reports, and Dashboards start populating to tell your unique story.
Can I create my own reports and dashboards?
Absolutely! Building your own reports and dashboards is easy. If for any reason you need help, simply check out one of our walk-thru guides from within the tool.
How does this compare to other business analytics solutions?
SplashCRM is a problem-focused solution using SplashBI, our business analytics platform. Unlike other BI or Sales Analytics tools, there is no need for expensive consultants or lengthy implementations. From the time you sign up, you can begin using the tool in as little as 10 minutes all at a fraction of the cost.
Do you support custom objects?
Yes! Getting your existing data in is easy. During your first-time sign in, you will be taken through an interactive data connection guide. While we pride ourselves on the data model powering our pre-built content, there are times where some of the KPIs might not reflect data correctly. In the event that happens, check out the guides to see how to re-map based on your unique custom objects.
How long does it take to implement?
10 minutes or less. Yes, it really is THAT quick. During your first time sign on, you are given a brief product tour instantly followed by an interactive data connection wizard. As soon as you have created the connection to your Salesforce Instance, the data starts flowing in. The size of your SFDC impacts how quickly the data pull takes, but this part is usually completed in just a few minutes. Once complete, all of the pre-built reports & dashboards come to life with YOUR data!

