SplashBI and UKG have teamed up to provide the best HR reporting solutions and dashboards for UKG users. In this article, we will delve into the features and benefits of this powerful partnership and how it adds value to you as a UKG user.
Specifically, we will cover:
- The benefits for both SplashBI and UKG as a result of this partnership
- The key features of SplashBI’s HR reporting platform for UKG users
- How UKG users can leverage SplashBI’s reporting platform to make data-driven HR decisions
By the end of this article, you’ll have a better understanding of how SplashBI’s integration with UKG can improve your HR reporting process and provide you with the insights you need to make informed decisions.
So, let us get started.
Why SplashBI?
SplashBI comes with 800+ pre-built reports and visualization, powering holistic fact- and insight-based people decisions at scale across organizations of all sizes.
Our People Analytics and HR reporting solutions, SplashBI for HR, seamlessly integrate with all UKG solutions. Currently, this integration is unidirectional, using REST APIs for data extraction.
Our Data Pipeline ensures seamless connectivity between UKG and SplashBI, providing access to a wealth of data and insights. Even if the data source is external, it fits into our standard data model (validated by UKG technical staff). This integration allows for the rapid deployment of UKG reporting capabilities, saving organizations from months of consulting exercises.
With our unique approach, organizations can improve their operational efficiencies and make data-driven decisions with speed and ease.
Our use cases:
- Pre-Built Reports & Dashboards
- Time to Value – Weeks – Not Months
- 800 Reports, Charts, KPI’s, Dashboards
- Drill Down Capabilities
- Multiple Data Sources
- Ad-hoc Reporting
- Cross Departmental / Beyond HR
- Leveraged Security
What makes our people analytics solution so unique?
For effective UKG reporting, we have added 7 different predictive algorithms that will help you predict the exit risks, skill gap and other important metrics by simply reviewing your data.
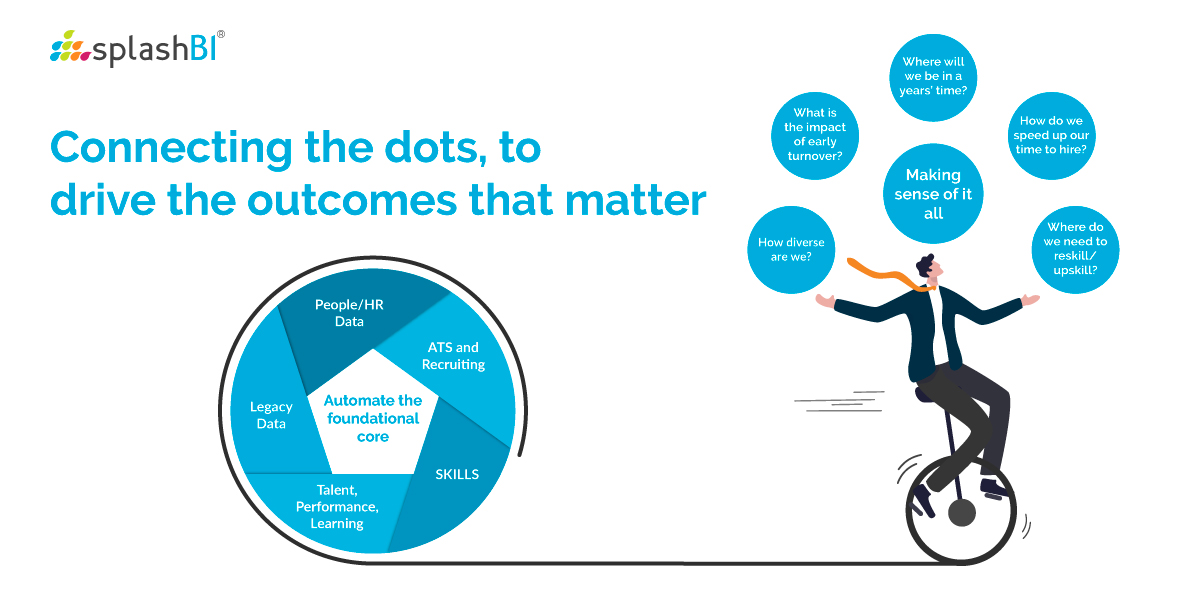
Recruiting Analysis
Understanding the best candidate fit aligns with supporting your brand. Get to grip with your recruitment strategy
- Key metrics to highlight the best areas attracting new employees
- Understand your pipeline of new recruits
- Get key insights such as:
- – What is the cost of time to hire?
- – How many open requests do we have?
- – What is the best source for different roles
- See how you can improve your recruiting efforts
Data can help uncover other meaningful insights and discover potential “roadblocks” – have you considered if there is any BIAS (Age, Gender, Ethnicity) in the process? Is this affecting our candidate pipeline? How does this impact our DEI&B Recruiting Strategy? Without analysis of your processes, you will struggle to uncover areas that need improvement.
Turnover Analysis
Get to grips with the cost of turnover in your organization.
- See the impact of employee turnover
- Understand trends and pinpoint areas to improve in real-time
- Lay the foundations for growth and improve business agility
- Increase employee engagement by sourcing quality hires
Learning and Skills Analysis
Focusing on skills creates a more equitable path to business and individual success:
- Understand how your learning programs are contributing to the overall success
- See what is popular and align it with your business units
- Track all your critical metrics (completions, success rates, popular course…..)
- See the impact as the organization embraces development
Diversity Analysis / DEI&B Insights
Get an instant snapshot of your organization’s workforce diversity and locate the sources of bias in recruiting, development, compensation, and performance management.
- Ensure you meet your key metrics on inclusion
- See trends and pinpoint areas to improve in real-time
- Accountability and transparency
- Lay a foundation for inclusiveness and ongoing business success
Why is SplashBI the right cost-effective solution for you?
Our vision is to create a truly meaningful people analytics capability, fully aligned with the business’s goals, to drive better outcomes.
The advantage of using SplashBI is that we have already done the hard work for you – meaning adoption and scale are within reach from the outset.
We simplify the hard stuff – we can connect you to any source using our connectors, API, or regular flat file, make sense of the data in our robust fit-for-purpose Data Model, and give your data home in our pre-built reports, charts, and dashboards. other
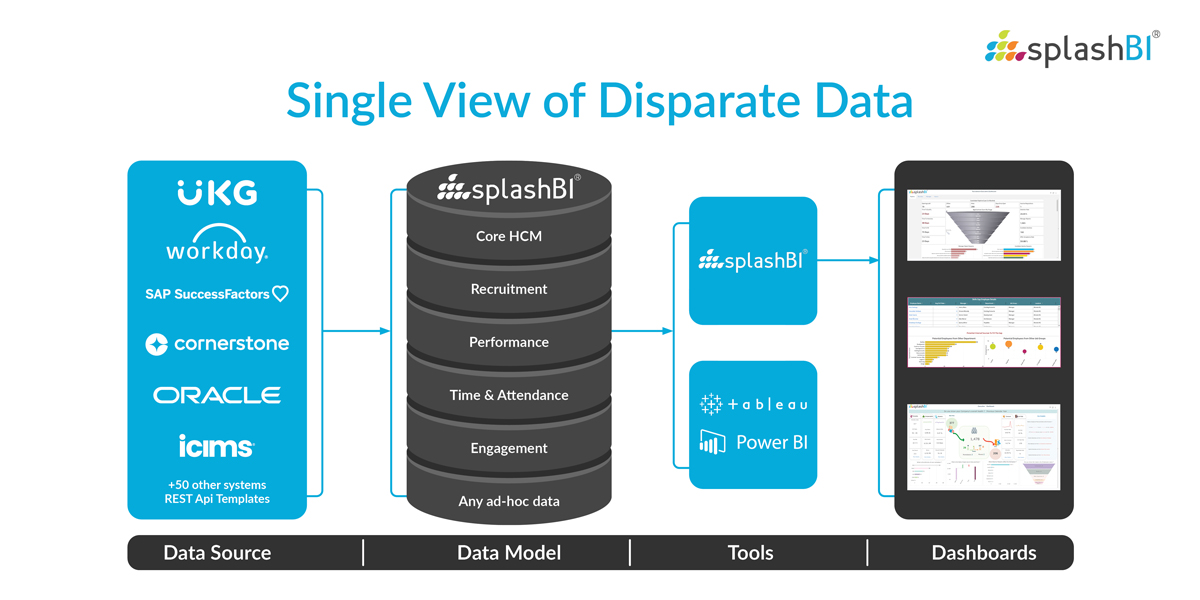
Our solution is based on the following four principles.
1. Automate
- Take advantage of our pre-built connectors to all the leading HR and Talent Systems
- Schedule data loads, full and incremental, to ensure your data is always fresh
- Simplify data distribution – all reports and dashboards can be pushed to the people that need it, whenever you specify
- Focus on the cool stuff while we take care of the “heavy lifting”
2. Extensible
- We’ve already taken care of a lot of the annoying stuff – use our pre-built charts and dashboards.
- We know you’ll want to take control, so you have full access to create any chart, dashboard or metric to suit your unique business requirements.
- You want to add or extend our data model? No problem – we give you full access.
- Your data – your way.
3. Interoperable
- You can easily take advantage of SplashBI to be your tool of choice.
- We also know your IT teams have invested in other tools, so leverage the power of your existing infrastructure in PowerBI or Tableau – easy!
- We even have a mobile app so your teams can always be up to date!
4. Secure
- Security is at the heart of what we do – trust us to ensure the most stringent of requirements are adhered to
- We can simply inherit your UKG Security Credential or other existing system values
- All the while allowing you to extend and configure any aspect
With a holistic pre-built integration between UKG and SplashBI, customers can leverage both solutions simultaneously to improve their recruiting, onboarding, and retention processes with deep people insights on hand.
Get started with SplashBI’s HR reporting platform for UKG today.
Contact us for assistance with any queries you have and benefit from our pre-built reports, advanced data analysis capabilities, and seamless UKG integration. Streamline your HR reporting and make data-driven decisions with confidence.
Frequently Asked Questions (FAQ’s)
SplashBI can seamlessly integrate with UKG Pro, Dimensions, Telestaff, and Ready.
SplashBI is simple, easy to launch, and can be implemented in 6 weeks or less. It comes with 800+ pre-built KPIs and metrics; you get your charts and analytics and have the ability, as an end user, to do ad-hoc reporting and share it with stakeholders.


