


Introduction
The role of Chief Human Resources Officer (CHRO) has undergone a profound transformation over time. Gone are the days of simply overseeing HR processes; today’s CHROs are pivotal in steering organizational success. As per Gartner’s research on HR, their mission will bring more focus on aligning talent strategy, people analytics, and business results to forge a competitive edge. To accomplish this mission, focusing on key metrics is imperative. In this blog, we will delve into the top 5 CHRO metrics that are poised to be significant in 2024.

1. Employee Engagement Score
Employee engagement is a foundational metric for CHROs. It serves as a mirror reflecting the emotional commitment of employees to their organization, a factor that directly influences productivity, retention rates, and overall business performance. According to Gallup in a recent publication, in 2022 more engaged employees closed 18% more sales, demonstrated 14% higher productivity results, and delivered 10% higher customer service satisfaction. In 2024, CHROs need to go beyond merely gauging engagement; they should investigate the underlying drivers. Since the pandemic employee engagement has been dropping at a steady 2% rate. Sophisticated sentiment analysis tools can be employed to identify the elements impacting engagement, enabling organizations to enact targeted strategies for enhancement. This metric delves deep into the emotional commitment of employees to their workplace. A high engagement score signifies a motivated and enthusiastic workforce, which translates into higher productivity and an overall positive impact on the bottom line by reducing turnover savings by 30%.
2. Talent Acquisition Expenditure
Talent acquisition continues to be a substantial investment for organizations. CHROs must meticulously monitor metrics like cost per hire, time-to-fill vacancies, and the offer accept rates. In 2022 Time to Hire was on average, 23 days across company types, 27 days globally, and 18.4 days in the US. A more refined approach involves evaluating the quality of hires and their influence on the organization. Metrics related to Talent Acquisition Expenditure, such as cost per hire and time-to-fill vacancies, shed light on how effectively the organization is recruiting new talent. By analyzing these metrics, CHROs can optimize recruitment tactics, cut down on costs, and ensure that they are bringing in the right talent to drive business expansion.

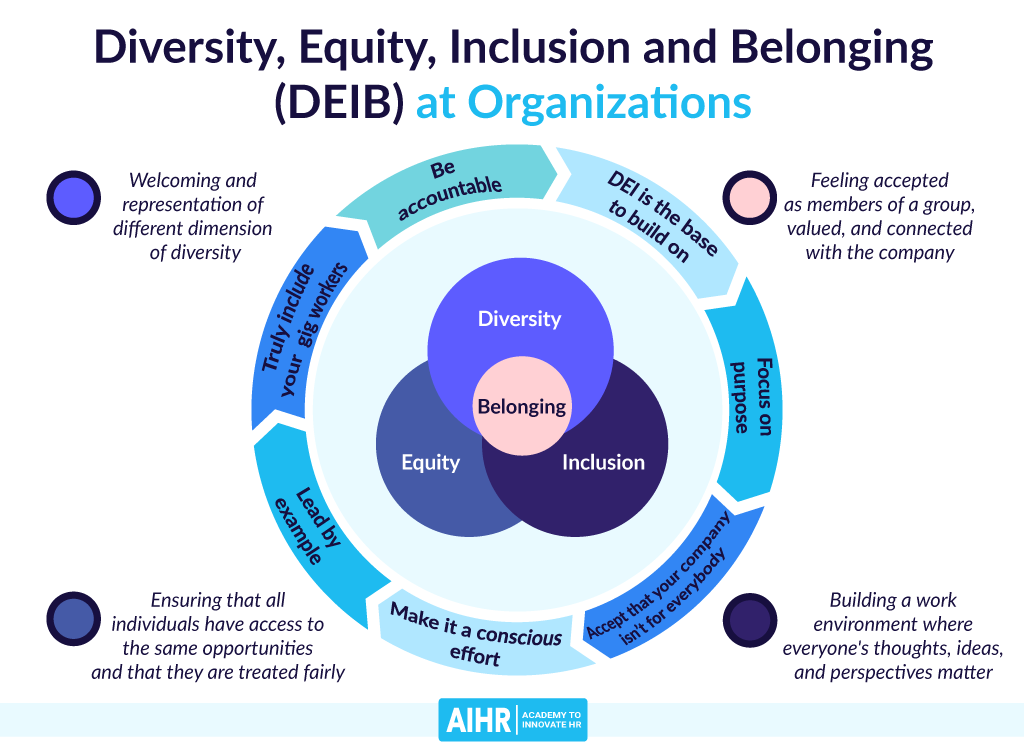
3. Metrics for Diversity, Equity, Inclusion, And Belonging (DEI&B)
Diversity, Equity, Inclusion, and Belonging have transcended the realm of buzzwords; they are now fundamental components of a thriving workforce. CHROs should prioritize tracking metrics such as diversity, including gender, ethnicity, age, disability, sexual orientation, etc, within their organizations. Metrics for Diversity, Equity, Inclusion, and Belonging (DEI&B) are at the forefront of CHRO priorities, encompassing Demographic Diversity, Equity and Pay Gap, and Employee Engagement. In 2022 the average gender pay gap in the US was 18% and the global representation of women in executive roles was 24%. ethnicity, age, and pay equity. Furthermore, assessing factors like these can pinpoint areas requiring attention. In 2024, the focus on DEI&B will continue to intensify, making these metrics even more vital.
4. Employee Well-being and Mental Health
Recent events have underscored the significance of employee well-being and mental health. CHROs should closely scrutinize metrics linked to employee stress levels, burnout rates, and utilization of mental health resources. As per Gartner, given the growing recognition of the importance of mental health. CHROs now closely monitor metrics like career, social, financial, physical, and community well-being, seeking to understand stress levels, burnout rates, and the utilization of mental health resources. An astounding 48% of employees quit because of childcare issues and 45% quit because of a lack of flexibility. This data can serve as a basis for crafting wellness programs, flexible work arrangements, and policies that support employees’ mental and emotional health.
Investing in employee development is indispensable for talent retention and organizational growth. CHROs ought to gauge the return on investment (ROI) generated by their learning and development initiatives. This encompasses tracking metrics such as Course Attendance Rate, Training Dropout Rate, Knowledge and Skill Retention, and the impact of training on key performance indicators. By establishing a clear connection between L&D efforts and business outcomes, CHROs can ensure that their training and development programs align seamlessly with stakeholder satisfaction.
Offering for the modern-day CHROs – SplashBI for HR is SplashBI’s comprehensive People Analytics solution, offering pre-built KPIs and dashboards alongside user customizability. Built on the SplashBI business intelligence data platform, SplashBI for HR empowers organizations to address crucial HR challenges while maintaining business process continuity. It provisions all levels within an organization’s employment hierarchy, aiding HR managers in tackling key issues like recruitment, employee turnover, and retention, closing skills gaps, and realizing cost savings by analyzing the benefits of different development strategies and allocating budget accordingly.
SplashBI’s capability to leverage these metrics lies in promoting collaboration among Human Capital and other verticals, ensuring a direct alignment of HR initiatives with overarching business objectives.
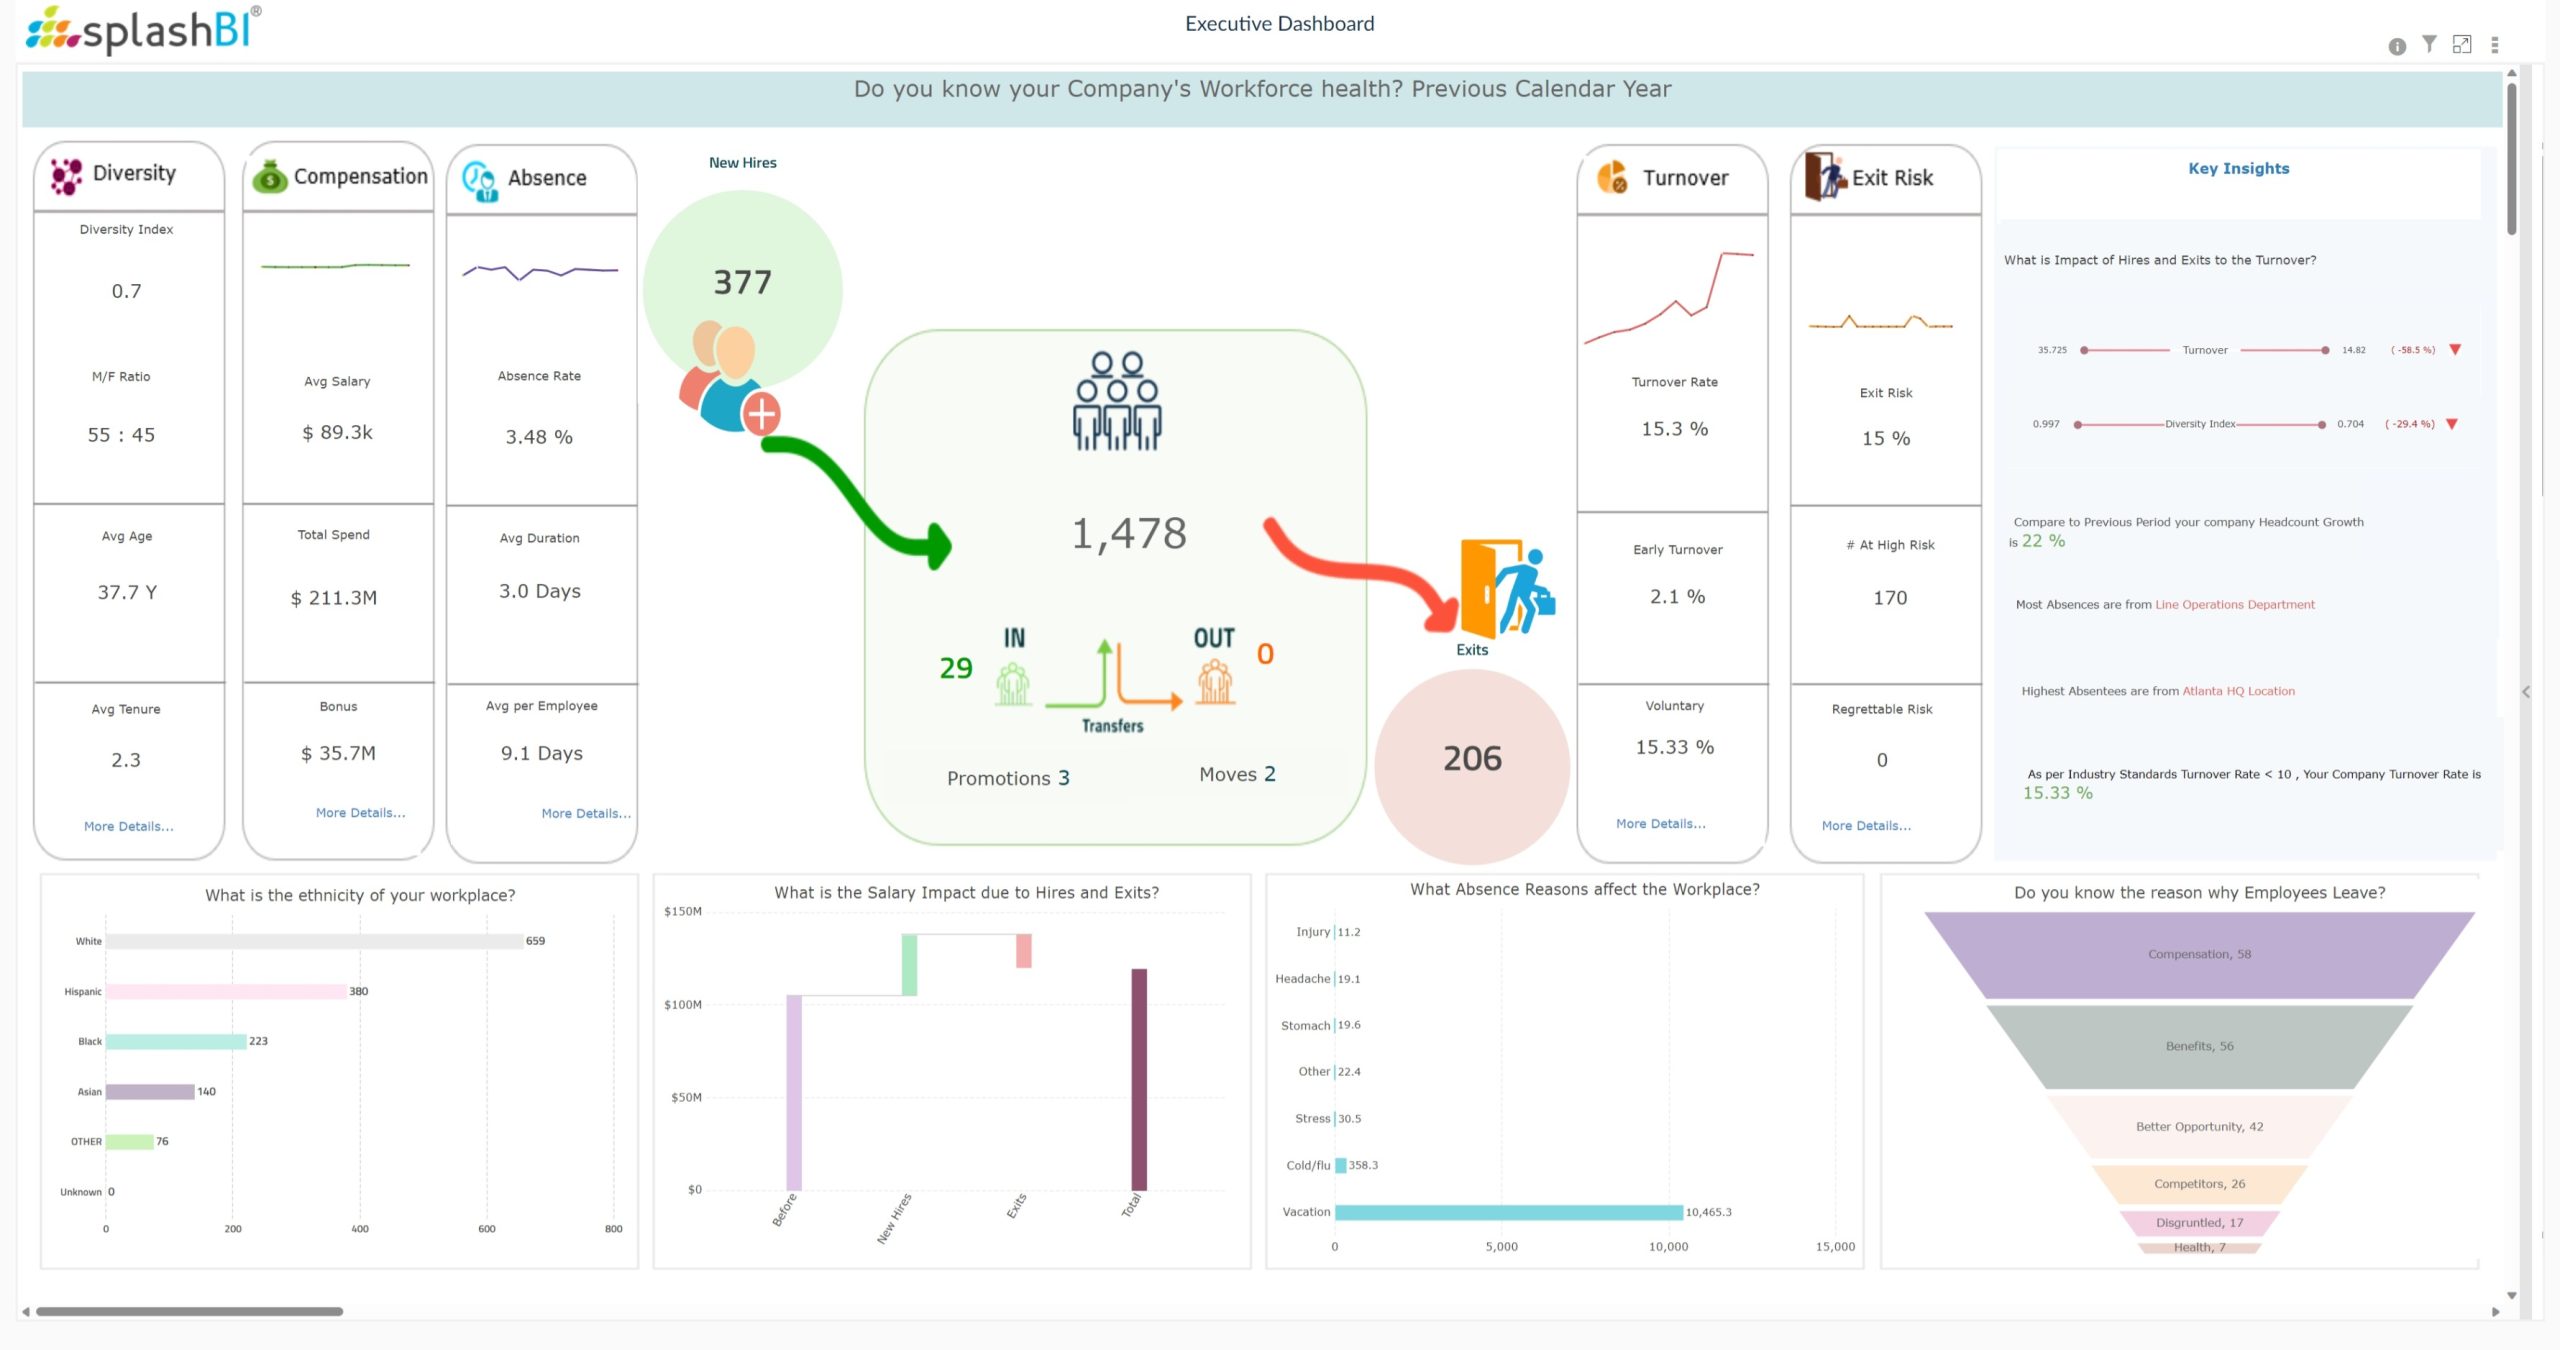
By diligently monitoring these top 5 metrics-Employee Engagement, Talent Acquisition Costs, DEI&B, Employee Well-being, and L&D ROI-CHROs can ensure that their talent management strategy harmonizes seamlessly with the aspirations of the organization, ultimately steering it towards resounding success. As the CHRO, you are not just overseeing HR functions; you are sculpting the future of your organization through the strategic management of its most invaluable asset: its human capital.

What metrics and KPIs should be included in executive workforce analytics dashboards that extend beyond native UKG Analytics capabilities?
How can organizations effectively measure the impact of workforce diversity on business performance?
What are the essential HR metrics for tracking diversity, equity, and inclusion (DEI) performance and compliance?
How does employee attrition differ from employee turnover?
What is an employee engagement score and how is it measured?
How do you measure return on learning and development (L&D ROI)?

The SplashBI Editorial team covers enterprise analytics, AI-driven decision-making, and the future of Finance and HR intelligence.