
Sales teams have no shortage of data.
Opportunities sit in CRM systems. Activities are recorded against accounts and contacts. Forecasts change every week. Quotas live in planning systems or spreadsheets. For some businesses, the downstream evidence of a sale, including the booked order, shipment, invoice, and receivable, sits in an ERP.
The challenge is turning all of that data into answers.
Sales analytics software helps organizations analyze sales performance, pipeline, conversion, forecasts, rep activity, revenue, and other sales metrics through reports, dashboards, and data analysis. More advanced sales analytics environments can also combine data from multiple business systems instead of limiting analysis to a single CRM.
That distinction is becoming increasingly important. Much of the sales analytics software market remains CRM-centric. Salesforce, for example, positions sales analytics around CRM-based sales performance, deal inspection, forecasting, and revenue intelligence. Salesforce
But for organizations where the sales process eventually flows into Oracle or another ERP, understanding the opportunity is only part of understanding the sale.
This guide looks at what sales analytics software does, which metrics matter, how sales analytics dashboards are used, where CRM reporting stops, and what organizations should evaluate before choosing a platform.
What is sales analytics software?
Sales analytics software is technology that collects, organizes, analyzes, and visualizes sales data so teams can understand performance and make better sales decisions.
Depending on the platform and the organization's data environment, that can include:
- leads and opportunities
- pipeline by sales stage
- sales activities
- conversion and win rates
- average deal size
- sales cycle length
- quota attainment
- forecast performance
- product and territory performance
- booked orders
- backlog
- revenue
- accounts receivable
CRM-native tools typically concentrate on the earlier parts of this list. Salesforce describes sales analytics as a way to gather actionable insights from sales data such as closed deals and forecast sales amounts. Salesforce
Business intelligence and enterprise analytics platforms can take the analysis further by combining sales information with data from finance, operations, ERP, marketing, or other systems.
This becomes particularly useful when the answer to a sales question does not live in one application.
Why sales analytics matters
Sales reporting tells you what happened. Sales analytics should help you understand what is happening, why it is happening, and where to investigate next.
Consider a sales leader who sees that quarterly pipeline has grown.
That number is useful, but it immediately creates more questions:
- Is pipeline growth coming from more opportunities or larger deals?
- Which products or territories are driving it?
- How much of the pipeline is late-stage?
- Is the win rate changing?
- Are deals spending longer in certain stages?
- Is forecasted revenue turning into actual business?
- Are closed opportunities becoming booked orders?
Without accessible underlying data, each question can turn into a separate reporting request.
Sales analytics software gives teams a more systematic way to move from an aggregate KPI to the transactions, accounts, opportunities, products, or teams behind it.
What does sales analytics software do?
Capabilities differ significantly across products, but good sales analytics software usually addresses several core reporting needs.
1. Pipeline analytics
Pipeline analytics helps teams understand the value and composition of open opportunities.
Common sales pipeline metrics include:
- total pipeline value
- pipeline by stage
- pipeline by rep
- pipeline by territory
- pipeline by product
- pipeline coverage
- opportunity age
- stage duration
- average deal size
- opportunities with little or no recent activity
Pipeline analysis can expose problems that a single pipeline total hides.
For example, pipeline may look healthy at an aggregate level while a disproportionate amount is sitting in early stages or has not moved for weeks.
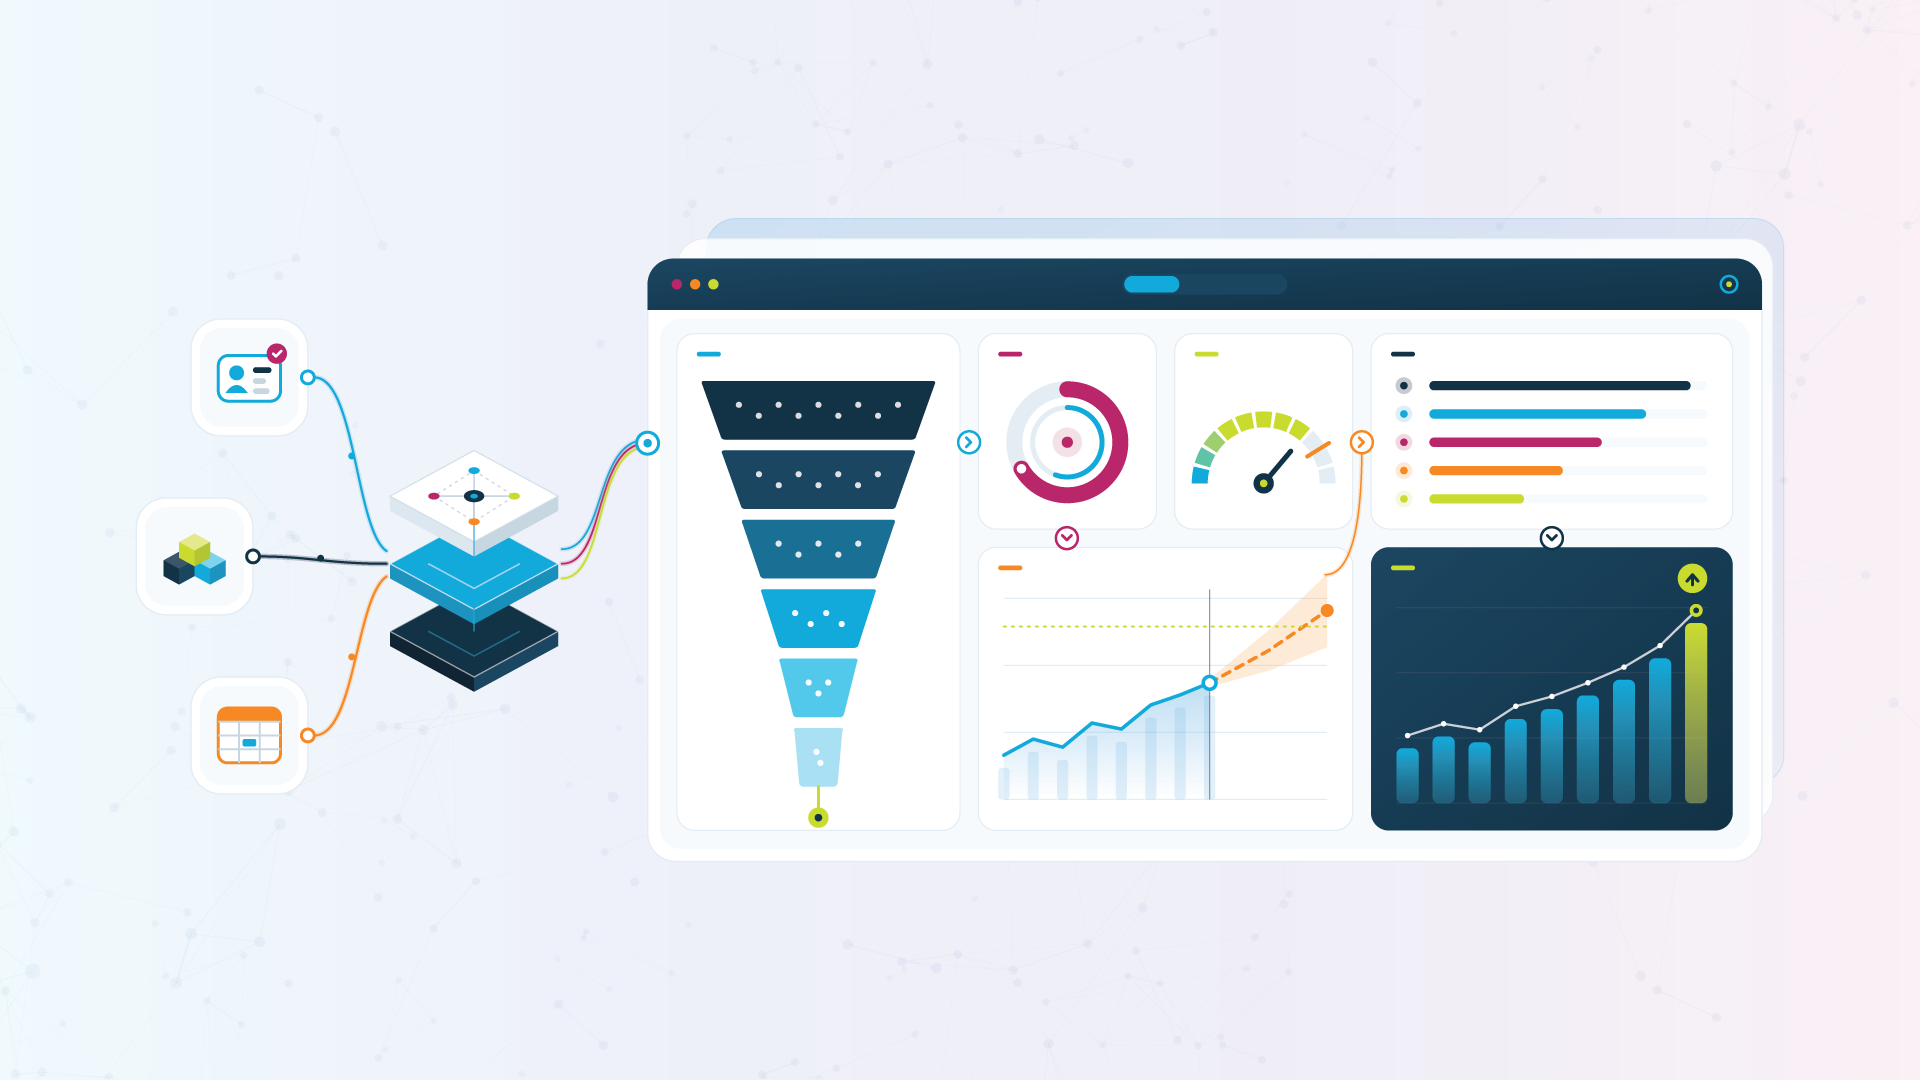
SplashBI's CRM Analytics offering includes pre-built sales reporting for pipeline and performance. Its sales rep dashboards include pipeline distribution, opportunity analysis, forecasted revenue by stage, win rates, activities, and lead flow. SplashBI
2. Sales performance analytics
Sales performance analytics focuses on how individuals, teams, products, territories, or business units are performing.
A sales performance dashboard might track:
- quota attainment
- revenue by rep
- won opportunities
- win rate
- average deal size
- sales cycle length
- losses by reason
- product performance
- discounting
- new versus existing business
The purpose is not simply to create a leaderboard.
Performance analytics becomes much more useful when leaders can drill into what is driving the result. A rep may have a lower win rate because of deal mix, territory, lead source, product, discounting, or unusually long sales cycles.
SplashBI's sales leader analytics, for example, includes views into sales performance, pipeline, wins and losses, sales cycles, activities, lead movement, and team trends. SplashBI
3. Sales forecasting analytics
Forecasting attempts to answer the question every revenue leader eventually gets asked:
What are we likely to close?
Sales analytics software can help teams compare:
- pipeline against quota
- forecast against actual performance
- committed versus upside opportunities
- current forecast against historical trends
- pipeline created versus pipeline converted
- forecast by rep, product, region, or business unit
CRM-native sales analytics platforms are particularly strong in this area. Salesforce, for example, supports forecast categories such as pipeline, best case, commit, closed, and most likely. Salesforce
But forecast accuracy is only one part of revenue visibility. For organizations selling through complex order and fulfillment processes, leaders may also need to understand what happens after the deal closes.
4. Conversion and win-rate analysis
A growing pipeline is not necessarily an improving pipeline.
Conversion analytics helps sales teams measure how opportunities move through the funnel.
Useful metrics include:
- lead-to-opportunity conversion
- opportunity-to-win conversion
- conversion by stage
- win rate
- loss rate
- stage-to-stage conversion
- average time in stage
- sales cycle length
Analyzing these metrics together provides more context than looking at any one in isolation.
A falling win rate, for example, means something different if average deal size is increasing significantly than if both metrics are declining.
5. Sales activity analytics
Sales activity analytics connects seller behavior with pipeline and outcomes.
Depending on the source data available, teams may analyze:
- calls
- emails
- meetings
- tasks
- account touches
- overdue activities
- opportunity activity
- time to first contact
The important distinction is between measuring activity and treating activity itself as performance.
A large number of calls or emails does not necessarily indicate a healthy pipeline. Activity becomes more useful analytically when teams can examine it alongside opportunity movement, conversion, and outcomes.
6. Product, account, and territory analytics
Sales performance is rarely uniform across the business.
Analytics can reveal differences between:
- products
- product categories
- industries
- territories
- regions
- customer segments
- new and existing customers
- sales channels
SplashBI's sales executive dashboards include product performance, pipeline by product, revenue, win/loss analysis, historical analysis, and sales trends. SplashBI
These views help executives understand not only whether the organization is hitting its number, but which parts of the business are driving it.
What should a sales analytics dashboard include?
There is no universal sales dashboard.
The right dashboard depends on the decisions its audience has to make.
Sales rep dashboards
A sales rep typically needs a focused operational view:
- current pipeline
- open opportunities
- upcoming activities
- pipeline by stage
- quota progress
- recent account activity
- opportunities needing attention
Sales manager dashboards
Managers need both aggregate and rep-level visibility:
- pipeline by rep
- conversion rates
- win/loss trends
- quota attainment
- sales cycle
- forecast
- activity levels
- stalled opportunities
Executive sales dashboards
Executives generally need higher-level performance and trends:
- performance against target
- forecast
- revenue
- pipeline coverage
- product performance
- geographic performance
- new versus existing business
- year-over-year trends
The useful principle is progressive detail.
Executives may begin with one number, but they should be able to investigate what sits behind it rather than waiting for another report to be assembled.
CRM sales analytics vs ERP sales analytics
This distinction matters most for businesses whose revenue process continues well beyond the CRM.
| CRM sales analytics | ERP and order-to-cash analytics |
|---|---|
| Leads and opportunities | Sales orders and bookings |
| Pipeline and sales stages | Backlog and fulfillment |
| Win rates and forecasts | Shipments and billing |
| Seller activity and quota | Receivables and downstream financial outcomes |
CRM analytics answers questions about the selling process.
ERP and order-to-cash analytics can help answer what happened after customer commitment.
The two should not be treated as substitutes.
For companies running Oracle Order Management, for example, Oracle's processes continue from sales order management through fulfillment and billing. Oracle defines backlog around sales orders that have been promised but have not yet shipped. SplashBI
The useful analytics question therefore becomes:
Do we only need to understand pipeline, or do we also need to follow what happens to that demand after it enters the ERP?
That is where sales analytics can become a cross-system problem rather than simply a CRM reporting problem.
What is order-to-cash analytics?
Order-to-cash, or O2C, covers the process from receiving a customer order through fulfillment, invoicing, receivables, and collection.
From an analytics perspective, relevant measures can include:
- orders
- booked value
- backlog
- fulfillment
- shipments
- invoices
- receivables
- DSO
- collections
- revenue
SplashBI's Finance Analytics includes Order-to-Cash analytics spanning AR aging and DSO, revenue analytics, order pipeline, cash flow forecasting, and collections dashboards. This is not the same thing as CRM pipeline analytics.
But bringing the two perspectives closer together can help sales and finance discuss performance from a more consistent set of underlying data.
Why sales and finance sometimes see different numbers
A VP of Sales and a Controller can both be looking at correct numbers and still be discussing different things.
Consider the terms pipeline, bookings, billings, and revenue.
They represent different points in the commercial and accounting lifecycle.
An opportunity may appear in the pipeline before there is a customer commitment. A booked order may precede shipment. Billing happens after the conditions for invoicing are met. Revenue recognition follows applicable accounting rules.
The numbers should therefore not be expected to match automatically.
The problem occurs when organizations put these metrics side by side without clearly defining them, or manually reconcile CRM and ERP reports every time executives need a shared view.
This is one reason cross-system sales analytics matters in Oracle environments.
SplashBI's Data Aggregation layer supports data from Oracle Fusion Cloud, Oracle E-Business Suite, Salesforce, and other enterprise applications in a governed data layer.
Its Oracle Fusion Data Pipeline can also consolidate Fusion data with Salesforce and other sources in a governed warehouse.
That creates the data foundation for cross-system analysis without implying that pipeline, bookings, billing, and revenue are the same measure.
Key sales analytics metrics to track
More metrics do not necessarily create better analytics.
The right set depends on how the business sells, but most organizations will draw from several categories.
Pipeline metrics
- total pipeline
- pipeline coverage
- pipeline by stage
- pipeline by product
- pipeline by rep
- opportunity age
- pipeline created
Conversion metrics
- win rate
- loss rate
- lead-to-opportunity conversion
- stage conversion rate
- average sales cycle
- time in stage
Performance metrics
- quota attainment
- revenue by rep
- bookings by rep
- average deal size
- product mix
- sales by territory
Forecast metrics
- forecast versus target
- forecast versus actual
- commit pipeline
- forecast accuracy
- historical forecast variance
Downstream revenue metrics
Where sales analytics extends into ERP or finance data, teams may also examine:
- booked orders
- open backlog
- shipments
- billed value
- accounts receivable
- collections
The objective is not to place every metric on one dashboard. It is to build a reporting model where each metric has a clear definition and users can move from high-level performance into the details that explain it.
Features to look for in sales analytics software
The market includes CRM analytics, revenue intelligence platforms, standalone BI products, and enterprise reporting tools.
That makes the underlying requirements more important than the category label.
Multi-source data connectivity
Start with a simple question:
Where does the data required to answer our sales questions live?
If everything sits in one CRM, native CRM analytics may be sufficient.
If sales, order, customer, finance, and product data spans Salesforce, Oracle, spreadsheets, warehouses, and other applications, multi-source analytics becomes more important.
Pre-built sales dashboards
Pre-built dashboards can reduce the amount of reporting teams need to design from scratch.
SplashBI's CRM Analytics product includes pre-built dashboards for sales reps, leaders, and executives, covering pipeline, performance, sales trends, opportunities, quota, win/loss, and other sales metrics.
Drill-down
Dashboards should help users investigate a number, not simply display it.
SplashBI supports Salesforce deep-linking and cross-object reporting, allowing users to move from dashboard-level views into underlying CRM information and create KPIs across objects.
Flexible reporting and distribution
Not every stakeholder consumes analytics through an interactive dashboard.
Teams may still need recurring executive packs, spreadsheets, PDFs, or scheduled reports.
SplashBI supports report distribution in Excel, PDF, and HTML, as well as an Excel add-in for transactional reporting.
Data governance
If different departments calculate pipeline, revenue, bookings, or customer metrics differently, a better visualization layer will not solve the underlying problem.
Look for the ability to create governed definitions and reusable data models so the same measures are not reconstructed independently for every report.
ERP depth
This criterion is easy to overlook because much of the sales analytics software category is CRM-first.
For Oracle-centric organizations, evaluate whether the platform can actually work with the operational and financial systems that contain the downstream sales data.
SplashBI's Oracle data pipeline covers Oracle ERP, HCM, SCM, PPM, and EPM data, including Order Management and Receivables-related domains. SplashBI
How to choose sales analytics software
Rather than starting with a long feature checklist, begin with the questions the business cannot answer easily today.
1. Define the decisions the software needs to support
Examples include:
- Are we likely to hit quota?
- Which deals are slowing down?
- Which territories are performing?
- Where are we losing opportunities?
- Which products are growing?
- How does forecast compare with actual performance?
- What happened to opportunities after they closed?
The last question immediately changes the data requirement.
2. Map the source of every important metric
Identify where pipeline, orders, invoices, products, customers, targets, and finance data originate.
This reveals whether a CRM-only solution is enough.
3. Agree on metric definitions
Define terms such as:
- pipeline
- qualified pipeline
- booking
- revenue
- forecast
- win
- sales cycle
- quota attainment
This is especially important when sales and finance share dashboards.
4. Test the drill path
A dashboard demo can look impressive while hiding how difficult it is to answer the next question.
Ask what happens when a leader wants to move from:
Total pipeline → region → rep → opportunity → source record
or from:
Order value → customer → order → invoice
The usability of that path often matters more than the number of chart types available.
5. Evaluate reporting workflows outside the dashboard
Ask how users:
- schedule reports
- export data
- work in Excel
- share insights
- create ad hoc reports
- reuse governed metrics
Analytics has to fit the way teams actually operate.
Where SplashBI fits in sales analytics
SplashBI approaches sales analytics in two directions.
Its Sales & CRM Analytics provides pre-built sales reports and dashboards across Salesforce, HubSpot, Oracle, and connected sales data, with role-specific views for reps, leaders, and executives. The product includes Salesforce deep-linking, cross-object reporting, report distribution, and Excel-based transactional reporting.
The broader SplashBI platform can then bring together data from enterprise systems including Oracle Fusion Cloud, Oracle E-Business Suite, and Salesforce through its data aggregation capabilities and data pipeline capabilities.
For organizations running Oracle, that means sales analytics does not have to end with the CRM pipeline.
Teams can build toward a broader view of sales and revenue data that includes the operational and financial information needed to understand what happened after an opportunity closed.
Explore SplashBI Sales & CRM Analytics
Sales analytics software should help you understand the number, not just display it
A sales dashboard can tell you that pipeline is $50 million.
Useful sales analytics tells you what makes up that $50 million, where it sits, how quickly it is moving, how likely it is to convert, who owns it, which products it represents, and how performance compares with previous periods.
For many sales teams, CRM data provides most of those answers.
For enterprises with more complex sales and fulfillment environments, it may not provide all of them.
The most useful sales analytics software is therefore not necessarily the platform with the most dashboards. It is the one that can connect the metrics your teams care about to the data required to explain them, whether that data lives in CRM, ERP, finance, or across several systems.
The SplashBI Editorial team covers enterprise analytics, AI-driven decision-making, and the future of Finance and HR intelligence.
Frequently Asked Questions
What is sales analytics software?
Sales analytics software analyzes sales data such as pipeline, opportunities, conversion, win rates, forecasts, quota attainment, and revenue. It typically presents this information through dashboards, reports, and visualizations that help sales teams understand performance and identify trends.
What are the most important sales analytics metrics?
Common sales analytics metrics include pipeline value, pipeline coverage, win rate, conversion rate, average deal size, sales cycle length, quota attainment, forecast accuracy, revenue, and performance by rep, product, or territory.
What is the difference between sales analytics and CRM reporting?
CRM reporting primarily analyzes data stored within the CRM, such as leads, opportunities, activities, pipeline, and forecasts. Sales analytics can be broader, combining CRM data with ERP, finance, marketing, product, or other enterprise data when those sources are required to understand sales performance.
Can sales analytics software connect CRM and ERP data?
Some enterprise analytics platforms can. SplashBI, for example, supports data from Salesforce, Oracle Fusion Cloud, Oracle E-Business Suite, and other enterprise applications through its data aggregation and pipeline capabilities. SplashBI
What is order-to-cash analytics?
Order-to-cash analytics examines data across the process from customer order through fulfillment, billing, accounts receivable, and collection. Common metrics include order pipeline, backlog, revenue, AR aging, DSO, cash flow, and collections. SplashBI's Finance Analytics includes reporting across several of these O2C areas. SplashBI
Does SplashBI provide sales analytics dashboards?
Yes. SplashBI provides pre-built dashboards and reports for sales reps, sales leaders, and executives, including pipeline, opportunities, performance, quota, forecast, win/loss, sales cycle, revenue, and historical analysis.