

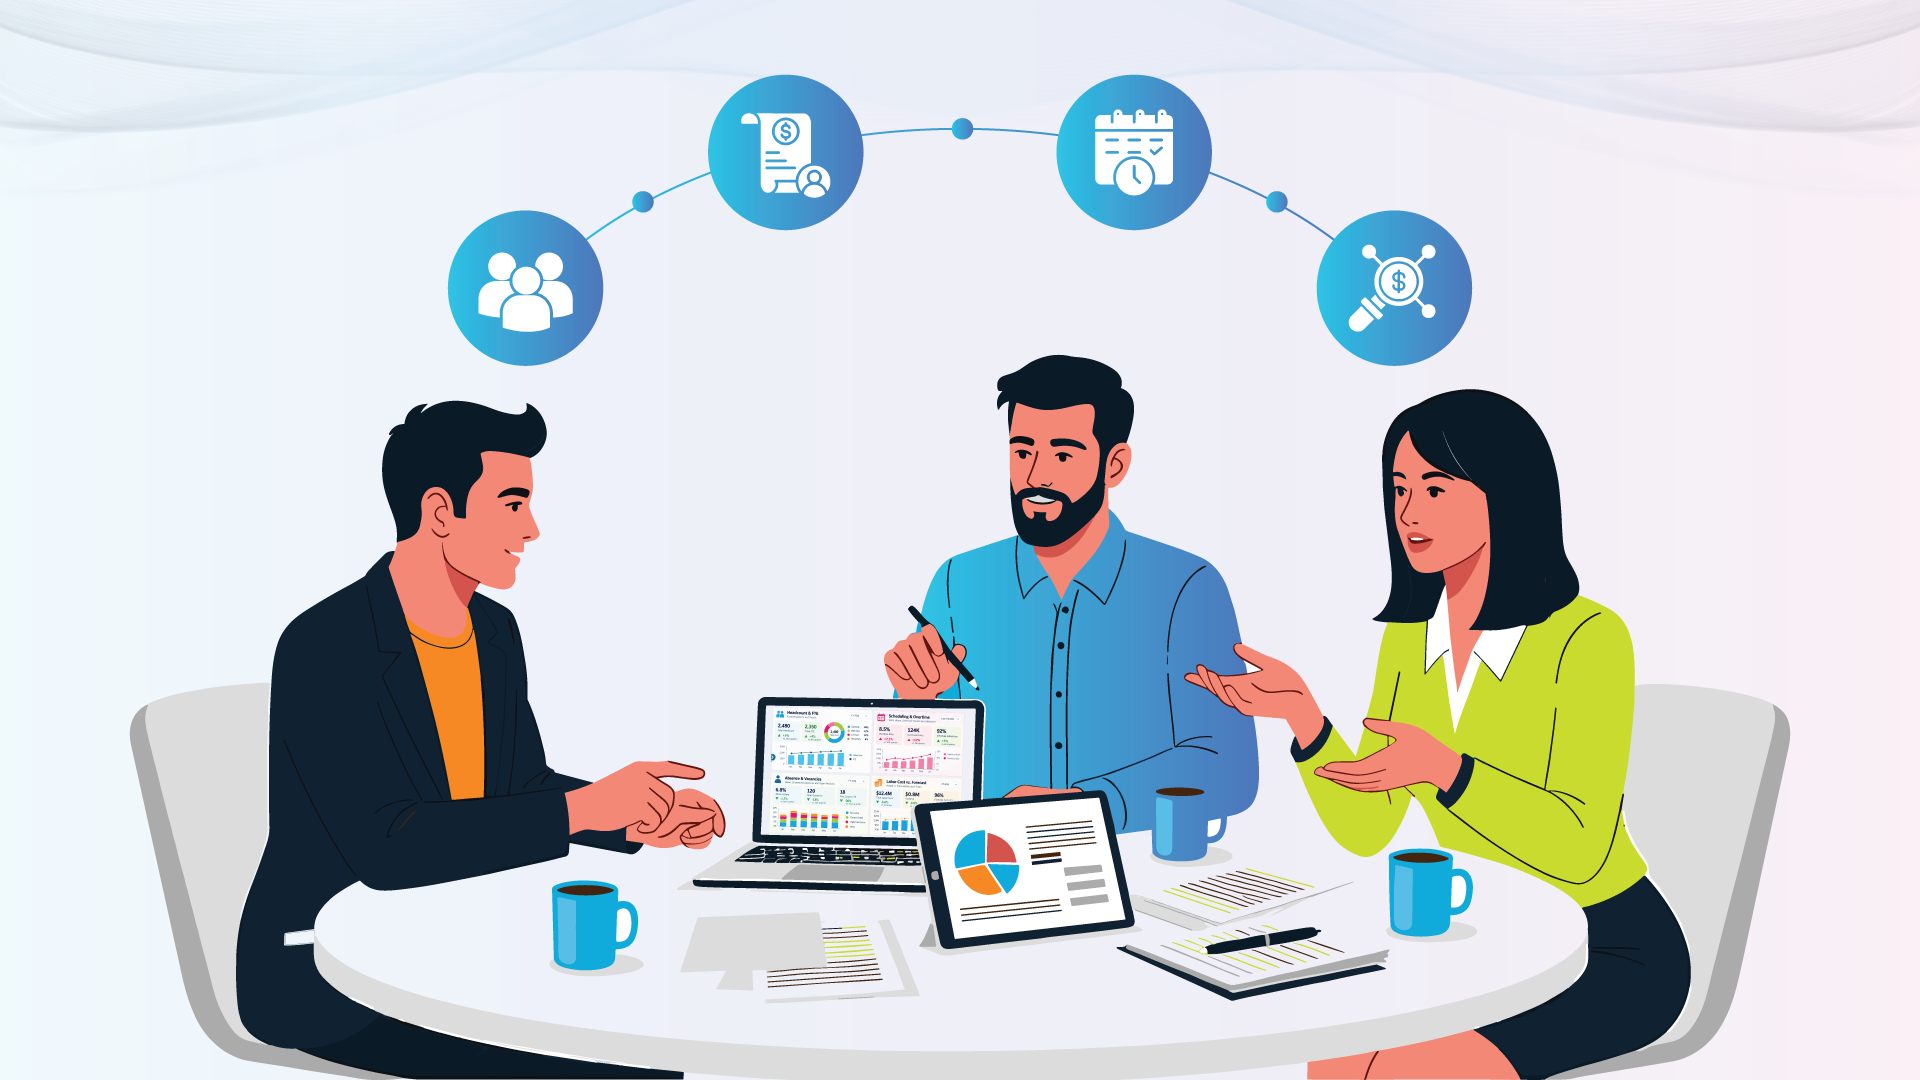
Workforce analytics software connects employee, position, scheduling, payroll, recruiting, and Finance data to produce governed measures such as headcount, FTE, overtime, vacancy rate, span of control, and labor cost. It helps HR, Operations, and Finance understand current workforce conditions, forecast requirements, and compare staffing decisions.
The best platform depends on the problem being solved. Some products specialize in enterprise workforce intelligence, while others focus on one HCM ecosystem, headcount planning, organizational design, or digital work activity.
What Is Workforce Analytics Software?
Workforce analytics software turns workforce data into metrics, trends, forecasts, and decision-ready analysis. Its purpose is not simply to count employees. It connects workforce supply, scheduled capacity, labor cost, and business demand through definitions that HR, Operations, and Finance can trust.
Common use cases include:
- Monitoring headcount and FTE by department, region, manager, or worker type
- Comparing actual labor costs with budgets and workforce plans
- Analyzing overtime, absence, scheduling, and capacity
- Measuring vacancies, spans of control, hiring demand, and time to fill
- Identifying attrition patterns and emerging workforce risks
- Modeling the cost and operational effect of hiring, restructuring, or expansion
- Giving executives and managers access to governed workforce dashboards
Our complete workforce analytics guide explains the descriptive, diagnostic, predictive, and prescriptive forms of analysis in more detail.
Workforce analytics also overlaps with people analytics, but the terms are not always used identically. People analytics often emphasizes the employee lifecycle, including recruiting, engagement, performance, retention, compensation, and skills. Workforce analytics typically places more emphasis on staffing capacity, schedules, FTE, absence, overtime, positions, and labor cost.
For a broader employee-lifecycle comparison, see our guide to people analytics software.
What Type of Workforce Analytics Software Do You Need?
The market includes several product categories that are often grouped under the same workforce analytics label. Identifying the category first prevents a polished demo from obscuring a mismatch in scope.
| Software Category | Primary Focus | Best Fit | Important Limitation to Test |
|---|---|---|---|
| Enterprise workforce intelligence | Cross-system HR, payroll, time, talent, scheduling, and Finance analysis | Organizations with multiple workforce systems or complex reporting needs | Depth of each connector, historical data, and cross-domain governance |
| Native HCM analytics | Reporting and insights within one HCM ecosystem | Organizations that primarily use one HCM suite | Data held outside the native ecosystem |
| Workforce planning and org design | Positions, headcount budgets, scenarios, approvals, and organizational structures | HR and Finance teams coordinating future workforce plans | Actual operational, payroll, and scheduling analysis |
| Work activity analytics | Application usage, focus time, workload, and digital work patterns | Organizations studying how digital work is performed | HR record depth, Finance integration, privacy, and employee transparency |
| General BI platforms | Custom dashboards across nearly any data source | Teams with established data engineering and BI resources | Time required to build workforce models, definitions, and security |
Employee activity monitoring is one form of workforce analytics, not the definition of the entire category. A buyer looking for overtime, vacancies, and payroll cost should not assume that a product centered on application activity will provide the required HCM and Finance model.
What Should Workforce Analytics Software Measure?
A useful platform should provide consistent definitions, historical trends, and drill paths behind each metric. The following are practical working definitions, but every organization must document its populations, exclusions, event dates, and calculation rules.
| Metric | Working Definition | Decision It Supports | Governance Question |
|---|---|---|---|
| Head count | Unique active workers on a specified reporting date | Current workforce size and distribution | How are multiple assignments, contingent workers, and leave handled? |
| FTE | Assigned or scheduled hours divided by standard full-time hours | Capacity and workforce-plan comparisons | Does the standard vary by country, contract, or worker group? |
| Overtime percentage | Overtime hours divided by total worked hours, multiplied by 100 | Coverage, workload, scheduling, and labor-cost review | Are premium, call-back, and special overtime categories treated consistently? |
| Absence rate | Absence hours divided by scheduled hours, multiplied by 100 | Attendance, coverage, and operational-risk analysis | Which paid and unpaid absence types are included? |
| Vacancy rate | Vacant approved positions divided by total approved positions, multiplied by 100 | Recruiting demand and capacity gaps | Are positions, requisitions, and budgeted openings clearly distinguished? |
| Span of control | Direct reports divided by the number of managers | Organizational design and management capacity | How are dotted-line, matrix, and temporary relationships handled? |
| Labor cost per FTE | Defined workforce cost divided by average FTE | Budgeting, location analysis, and workforce productivity | Does cost include salary, payroll tax, benefits, contractors, and overhead? |
Metrics should be available by dimensions such as entity, business unit, department, location, manager, job, grade, worker type, and period. Reviewers should also be able to move from an enterprise total to the records that explain it.
Recruiting measures require the same discipline. Time to fill, time to hire, source quality, and offer acceptance can produce misleading comparisons when teams use different starting events or candidate populations. See our guide to recruitment metrics and people analytics for examples.
Predictive workforce analytics can add attrition risk, demand forecasts, or capacity projections. These results should be treated as decision support, not certainty. Organizations should review model inputs, bias controls, appropriate use, and the consequences of acting on a prediction.
How Should You Compare Workforce Analytics Platforms?
The most useful evaluation starts with real business questions and source data, not a generic feature checklist.
| Evaluation Area | Question to Ask |
|---|---|
| Source coverage | Does the platform support the exact HCM, payroll, time, ATS, scheduling, and Finance products in use? |
| Connector depth | Which fields, history, hierarchies, and incremental updates does each connector support? |
| Effective-dated history | Can the platform reconstruct workforce conditions as they existed on a previous date? |
| Metric governance | Can definitions, populations, hierarchies, and calculation changes be centrally controlled? |
| Time and scheduling | Can users analyze scheduled hours, worked hours, overtime, absence, roster coverage, and labor demand? |
| Finance integration | Can workforce activity be connected with budgets, actual labor costs, cost centers, and financial results? |
| Security | Does access follow source roles, manager hierarchies, row-level rules, and sensitive-field restrictions? |
| Planning | Can teams model hiring, vacancies, reorganizations, labor costs, and alternative scenarios? |
| AI governance | Are natural-language answers constrained by approved metrics and permissions? Can reviewers inspect the query? |
| Implementation | What is pre-built, what must be configured, and who owns future changes? |
During a proof of concept, provide representative historical data and ask each vendor to answer the same questions. Include a multi-assignment employee, a manager hierarchy change, a retroactive payroll adjustment, a restricted population, and a metric definition change.
5 Workforce Analytics Software Platforms to Consider
The following platforms serve different parts of the market. This is a fit-based shortlist, not a claim that one product is universally best.
| Platform | Best Fit | Publicly Emphasized Strength | What to Validate |
|---|---|---|---|
| SplashBI | Multi-system workforce analytics across HR, Operations, and Finance | Pre-built workforce content, broad HCM connectivity, cross-domain analytics, and governed conversational AI | Source-specific field coverage and configuration requirements |
| Visier | Large-enterprise people and workforce analytics | Packaged workforce data infrastructure, models, analytics, benchmarks, and AI | Implementation scope, licensing, and fit for operational scheduling data |
| Workday People Analytics | Organizations centered on Workday HCM | Out-of-the-box workforce metrics, prioritized insights, and explanatory narratives | External system coverage and required add-on products |
| ChartHop | Collaborative headcount planning and organizational design | Visual org modeling, position planning, headcount costs, and HR-Finance collaboration | Payroll, time, scheduling, and detailed operational analytics |
| ActivTrack | Digital work activity and productivity analysis | Analysis of work patterns across remote, hybrid, and office environments | HCM and Finance depth, privacy controls, and employee transparency |
1. SplashBI
SplashBI Workforce Intelligence is designed for organizations that need to connect workforce data from systems such as Oracle HCM, Workday, UKG, SAP SuccessFactors, Dayforce, iCIMS, and Finance applications. Its differentiator is the combination of packaged workforce content, multi-system reporting, labor-cost analysis, security inheritance, and conversational analytics.
This makes SplashBI a strong fit when the main problem is not a lack of charts, but conflicting definitions and fragmented data across HCM, payroll, scheduling, recruiting, and Finance systems.
2. Visier
Visier provides a workforce data and analytics platform with data engineering, modeling, reporting, AI, security, and governance capabilities. It is designed for organizations building or expanding an enterprise people analytics practice and emphasizes packaged workforce content rather than a generic BI starting point.
Buyers should evaluate its support for their particular workforce management, scheduling, and financial sources, along with the implementation and licensing model appropriate to their organization.
3. Workday People Analytics
Workday People Analytics provides workforce KPIs and insights within the Workday ecosystem. Its documented capabilities include out-of-the-box metrics, prioritized workforce insights, explanatory summaries, and analysis of areas such as hiring, attrition, leadership, inclusion, and skills.
It can be a logical choice for Workday-centered organizations. Teams with workforce data spread across other HCM, payroll, scheduling, or Finance platforms should validate how those sources will be incorporated.
4. ChartHop
ChartHop Headcount Planning focuses on connecting organizational structures, headcount plans, costs, and approvals. It is particularly relevant when HR and Finance need to collaborate on positions, hiring plans, reorganizations, or alternative organizational scenarios.
Buyers should determine whether their requirement stops at planning and organizational design or extends into detailed payroll, overtime, absence, roster, and operational workforce analysis.
5. ActivTrak
ActivTrak analyzes digital work activity to help organizations understand productivity, workload, focus, and how work is performed across office, remote, and hybrid environments.
This represents a different segment from HCM-centered workforce intelligence. Organizations considering work activity analytics should evaluate privacy, transparency, access, data retention, and employee-relations implications, as well as whether they separately need headcount, position, payroll, or labor-cost analytics.
Workforce Analytics Software Versus a Custom Warehouse and BI Stack
A custom data warehouse and BI stack offers flexibility, but the organization must build and maintain the workforce model, effective-dated history, metrics, dashboards, security, testing, and source pipelines. Packaged workforce analytics software reduces that starting effort but still requires mapping, validation, governance, and ownership.
The following is an illustrative cost profile for a 5,000-employee organization. It compares areas of work rather than unverified dollar amounts.
| Cost Area | Specialist Workforce Analytics Platform | Custom Warehouse and BI Stack |
|---|---|---|
| Source connectivity | Configure and validate available connectors | Design, build, monitor, and update APIs or ETL pipelines |
| Historical model | Adapt a packaged workforce model | Design effective-dated employee, position, organization, and event history |
| Metric development | Validate and modify pre-built definitions | Define, build, test, and document every metric |
| Dashboards | Configure packaged content and permissions | Design and build dashboards, drill paths, and exports |
| Security | Map platform controls to enterprise roles and policies | Engineer access across storage, models, BI, and distribution |
| Testing | Test source reconciliation, definitions, and user access | Test all pipelines, transformations, calculations, dashboards, and controls |
| Ongoing maintenance | Manage releases, mappings, model changes, and governance | Maintain the full data, semantic, visualization, and infrastructure stack |
| Main tradeoff | Subscription and implementation cost in exchange for a faster starting point | Maximum control in exchange for more internal engineering and ownership |
A custom approach may make sense when the organization already has mature data engineering, semantic modeling, and workforce analytics teams. A specialist platform becomes more attractive when decision-makers need pre-built content and connectors without turning every workforce question into a new development project.
Why SplashBI Stands Out for Multi-System Workforce Analytics
SplashBI is strongest when workforce information is fragmented across HCM, payroll, recruiting, time, scheduling, and Finance applications. Its value comes from connecting those systems to a governed workforce model rather than treating each source as a separate reporting island.
Pre-built workforce content without starting over
SplashBI documents more than 800 pre-built HR KPIs and 30-plus dashboards covering workforce health, recruiting, compensation, performance, compliance, turnover, and related topics. It states that the dashboards can be deployed in under four weeks and then adapted to the organization's requirements.
Pre-built does not mean zero configuration. Teams must still validate active-worker definitions, assignment handling, hierarchies, security, history, time periods, and financial mappings. The advantage is that metric and dashboard design starts from an established structure.
See examples of how these measures can be organized in people analytics dashboards.
Connectivity beyond the core HCM
SplashBI documents more than 100 pre-built HCM connectors. Named systems include Oracle HCM Cloud and Fusion, Workday, SAP SuccessFactors, UKG, Dayforce, iCIMS, and Cornerstone OnDemand. Custom pipelines and CSV ingestion can bring in additional sources.
Its UKG coverage is particularly relevant to operational workforce analytics. SplashBI's UKG TeleStaff roster and schedule reporting uses UKG REST APIs to support public safety scheduling and rostering analysis. Related reporting can examine time, attendance, overtime, utilization, labor cost, and resource allocation.
Buyers should still test the exact source products, fields, history, update processes, error handling, and permissions they require.
Headcount, time, and labor cost in one model
Connecting HR and Finance makes it possible to analyze questions that neither function can answer completely alone:
- How does actual labor cost compare with the workforce plan?
- Which departments are using overtime to cover persistent vacancies?
- What is the cost per FTE by region or operating unit?
- How will planned hiring affect the budget?
- Are absence, turnover, or scheduling patterns contributing to cost pressure?
- What is the financial effect of an unfilled position or staffing scenario?
SplashBI reports that 25 to 30 percent of its customers use HR and Finance together. This cross-domain model can give CHROs and CFOs a shared basis for workforce planning instead of separate spreadsheets with competing definitions.
Security, governance, and deployment
Workforce data includes compensation, identity, performance, absence, and other sensitive information. Security should therefore be evaluated as part of the analytical architecture, not added after dashboards are built.
SplashBI supports native HCM security inheritance, role-based access, manager and team restrictions, SSO through SAML 2.0, two-factor authentication, encryption, and access logging. It documents SOC 1 Type 2, SOC 2 Type 2, ISO 27001:2022, and GDPR controls.
Organizations can also evaluate on-premises and cloud deployment according to their architecture and governance requirements. Access should be tested with real roles, including executives, HR business partners, managers, analysts, and users whose access changes after an organizational move.
A governed semantic layer for enterprise reporting helps ensure that permissions and metric definitions remain consistent across dashboards, exports, and AI-assisted analysis.
Governed AI after the data foundation
SplashAI allows users to ask workforce questions in natural language against governed enterprise data. It inherits semantic models, metadata, role-based access, row-level security, and audit controls. It can also display the SQL behind a response, supporting review of how the answer was generated.
Users can continue with follow-up questions, move into more detailed segments, and work through dashboards or Microsoft Teams. SplashAI is designed to operate across HR and Finance, making questions such as workforce cost versus budget possible within the same analytical context.
AI does not replace source validation, governance, or employment judgment. It should not make employment decisions independently. Its value comes after the organization has connected its data and established trusted definitions.
SplashBI describes this progression as:
- CONNECT: Bring workforce, operational, and financial data together.
- UNLOCK: Apply governed metrics, models, permissions, and dashboards.
- ASK: Use SplashAI to explore that governed information through natural language.
Together, these stages create an AI BI Flywheel in which connected data supports analysis, questions reveal new needs, and governed insights inform the next decision.
Choose Workforce Analytics Software Around the Decisions You Need to Make
The best workforce analytics software is the platform that can answer the organization's real staffing, capacity, cost, and planning questions with consistent definitions and appropriate security.
Organizations operating Workday, Oracle HCM, UKG, SAP SuccessFactors, recruiting systems, and Finance applications should pay particular attention to cross-system history, metric governance, and connector depth. When those requirements are central, SplashBI Workforce Intelligence provides a packaged route from fragmented workforce data to governed operational and financial analysis.

The SplashBI Editorial team covers enterprise analytics, AI-driven decision-making, and the future of Finance and HR intelligence.
Frequently Asked Questions
What is workforce analytics software?
Workforce analytics software connects employee, position, scheduling, payroll, recruiting, and financial data to calculate workforce metrics and support staffing decisions. Common measures include headcount, FTE, overtime, absence, vacancies, span of control, attrition, and labor cost. More advanced platforms add forecasting, scenarios, alerts, and natural-language analysis.
What is the difference between workforce analytics software and people analytics software?
People analytics software usually emphasizes employee-lifecycle questions such as recruiting, retention, engagement, performance, compensation, and skills. Workforce analytics software often places greater emphasis on headcount, positions, schedules, overtime, absence, capacity, vacancies, and labor cost. Many enterprise platforms support both areas, so buyers should evaluate actual data models and features.
Which workforce analytics software works with UKG, Workday, and Oracle HCM?
SplashBI is a strong fit for organizations using UKG, Workday, Oracle HCM, or a combination of these systems. It provides pre-built HCM connectors and supports custom pipelines and CSV ingestion. Buyers should validate the exact UKG or Oracle product, required fields, historical coverage, security, and refresh process during evaluation.
What metrics should a workforce analytics platform include?
A core platform should include headcount, FTE, hires, exits, attrition, vacancies, span of control, absence, overtime, time to fill, and labor cost. It should also allow each metric to be analyzed by organization, location, manager, job, grade, worker type, and period using documented definitions.
Can workforce analytics software replace a data warehouse?
Sometimes, but not universally. Some platforms provide integrated storage, models, pipelines, and analytics, while others operate over an existing warehouse or source system. The right architecture depends on source complexity, enterprise data strategy, historical requirements, performance, governance, and whether workforce data must be combined with other business domains.
How much does workforce analytics software cost?
Pricing depends on workforce size, users, source connectors, modules, deployment, data volume, implementation services, and support. Buyers should compare total cost rather than subscription price alone. Include integration, historical modeling, dashboard development, testing, security, training, infrastructure, and ongoing maintenance in the calculation.