Any format that visually represents data is Data Visualization. It can be a chart, a graph, images, etc. Whatever enables the data to communicate is vital to help analyze the data.
 Importance of Data Visualization
The importance of Data visualization is – analyzing complex data, identifying patterns, and extracting valuable insights. Simplifying complex information and presenting it visually enables decision-makers to make informed and effective decisions quickly and accurately.
Data visualization is essential to assist businesses in quickly identifying data trends, which would otherwise be a hassle. The pictorial representation of data sets allows analysts to visualize concepts and new patterns. With the increasing surge in data every day, making sense of the quintillion bytes of data is impossible without Data Proliferation, which includes data visualization.
Every professional industry benefits from understanding their data, so data visualization is branching out to all fields where data exists. For every business, information is their most significant leverage. Through visualization, one can prolifically convey their points and take advantage of that information.
A dashboard, graph, infographics, map, chart, video, slide, etc. all these mediums can be used for visualizing and understanding data. Visualizing the data enable decision-makers to interrelate the data to find better insights and reap the importance of data visualization, which are:

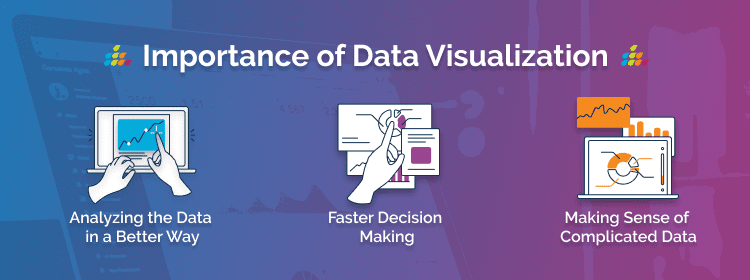
1. Analyzing the Data in a Better Way
Analyzing reports helps business stakeholders focus on the areas that require attention. The visual mediums help analysts understand the key points needed for their business. Whether it is a sales report or a marketing strategy, a visual representation of data not only aids in comprehending complex information but also empowers companies to develop a data driven business strategy. This strategic approach enables organizations to increase their profits through better analysis and informed business decisions.
2. Faster Decision Making
Humans process visuals better than any tedious tabular forms or reports. If the data communicates well, decision-makers can quickly take action based on the new data insights, accelerating decision-making and business growth simultaneously. Utilizing effective business intelligence solutions can further enhance this speed by providing real-time insights and analytics.
3. Making Sense of Complicated Data
Data visualization allows business users to gain insight into their vast amounts of data. It benefits them to recognize new patterns and errors in the data. Making sense of these patterns helps the users pay attention to areas that indicate red flags or progress. This process, in turn, drives the business ahead.
What is the Purpose of Data Visualization?
The purpose of data visualization is pretty clear. It is to make sense of the data and use the information for the organization’s benefits. That said, data is complicated, and it gains more value as and when it gets visualized. Without visualization, it is challenging to quickly communicate the data findings and identify patterns to pull insights and interact with the data seamlessly.
Data scientists can find patterns or errors without visualization. However, it is crucial to communicate data findings and identify critical information from them. And for this, interactive data visualization tools make all the difference.
A relevant and recent example is the ongoing pandemic. Yes, data scientists can look into the data and gain insights. But data visualization is assisting experts in staying informed and calm with such an abundance of data.
- Data visualization strengthens the impact of messaging for your audiences and presents the data analysis results in the most persuasive manner. It unifies the messaging systems across all the groups and fields within the organization.
- Visualization lets you comprehend vast amounts of data at a glance and in a better way. It helps to understand the data better to measure its impact on the business and communicates the insight visually to internal and external audiences.
- Decisions can’t be made in a vacuum. Available data and insights enable decision-makers to aid decision analysis. Unbiased data without inaccuracies allows access to the right kind of information and visualization to represent that information and keep it relevant.
Data visualization has the potential to solve many business issues. All businesses must incorporate data visualization tools and reap transformative benefits in their critical areas of operations.

Uncovering the Benefits of Data Visualization Tools
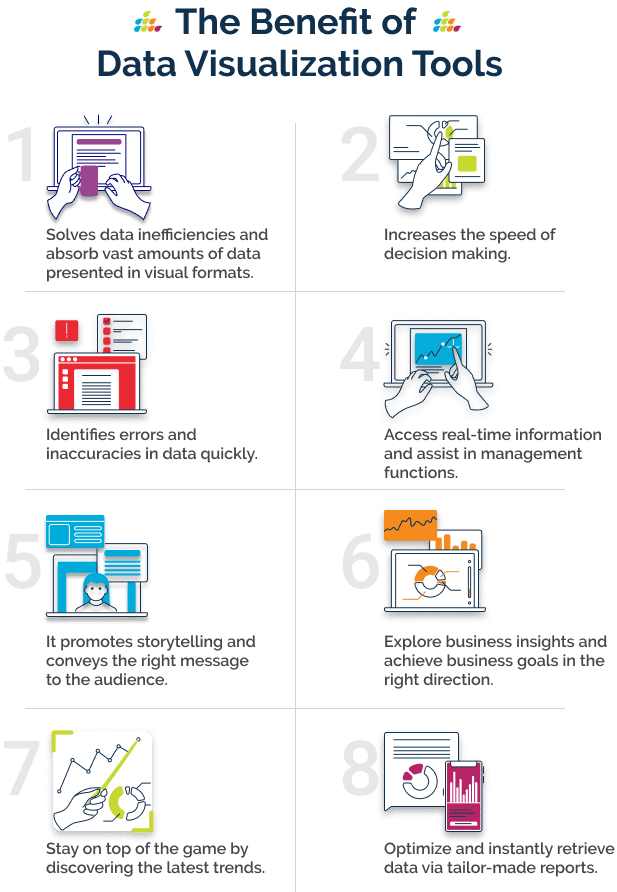
1. Effective Data Visualization is the key to unlock Big Data. It can solve any data inefficiencies and easily and instantly absorb vast amounts of data presented in visual formats.
2. By enabling users to understand data rapidly, visualization can quickly increase the speed of decision making as well. Any business must make fast decisions and not get bogged down by inefficiencies. Timely actions result in averting any losses and benefit from any market condition.
3. A big reveal for any differences in the trends and patterns is vital for any business’s survival. It is critical to know what is causing increased losses or what is required to maximize gains.
4. Visualization helps identify errors and inaccuracies in data quickly.
5. Companies can utilize visualization to access real-time information and assist in management functions significantly. Decision-makers can benefit from on-demand data through real-time reporting tools that enhance operational effectiveness.
6. It promotes storytelling in the most compelling way. Visuals are used in the most meaningful way to convey the right message to the audience.
7. Data visualization assists in exploring business insights to achieve business goals in the right direction. It helps to correlate the data from the visual representations or graphical representations. It allows for fast analysis and instantly digests critical metrics.
8. It enables enterprises to stay on top of their game by discovering the latest trends through data visualization tools.
9. Without data visualization, businesses would have to spend tons of their time customizing reports and modifying dashboards replying to ad hoc requests, etc. The benefits of Data visualization tools optimize and instantly retrieve data via tailor-made reports, which significantly cuts down on employee time and optimizing reporting processes through effective tools like Excel reporting solutions significantly improves efficiency.
Data Visualization Has a Creditable Impact on Businesses
While big data is conquering industries. Business Intelligence is taking huge strips of data and turning it into insightful data points. Data visualization is doing its part by quickly presenting the data to transfer the information to a human brain.
There is a lot of aesthetic value in visualization that accounts to represent a clear message and convey it.
For businesses where data is the single most crucial thing, they will start going out of business without data visualization. The winning competitive advantages of data visualization can make or break companies. It is imperative to recognize that we have no shortcuts to make faster and better decisions in this time and age without visualizing the data.
How SplashBI Can Help!
SplashBI offers immersive dashboards, which can make a massive difference in the way data visualizations impact your company. SplashBI’s visual composer is the best resource for data visualization tools in the industry.
With over 100 types of charts and interactive dashboards, it enables increased visibility and leverage hidden patterns within your company’s data to make impactful data-driven decisions.


