*Timelines vary based on system complexity and data size.
People Analytics Solution & Platform
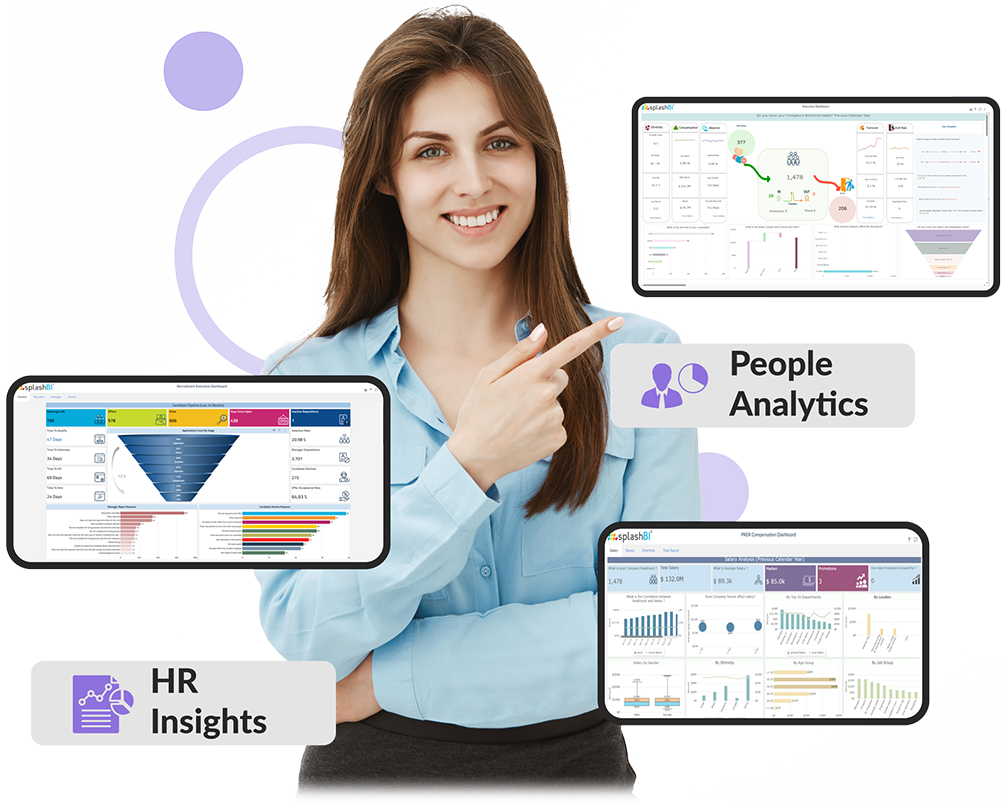
Real-Time HR Insights Across the Entire Employee Lifecycle, All In One Place.
Analyse turnover, diversity, skill gaps, recruitment metrics, and compensation data for optimal talent management.
800
50
6 Weeks*
Track Key HR Metrics in Real-Time
On a Single Interactive Dashboard
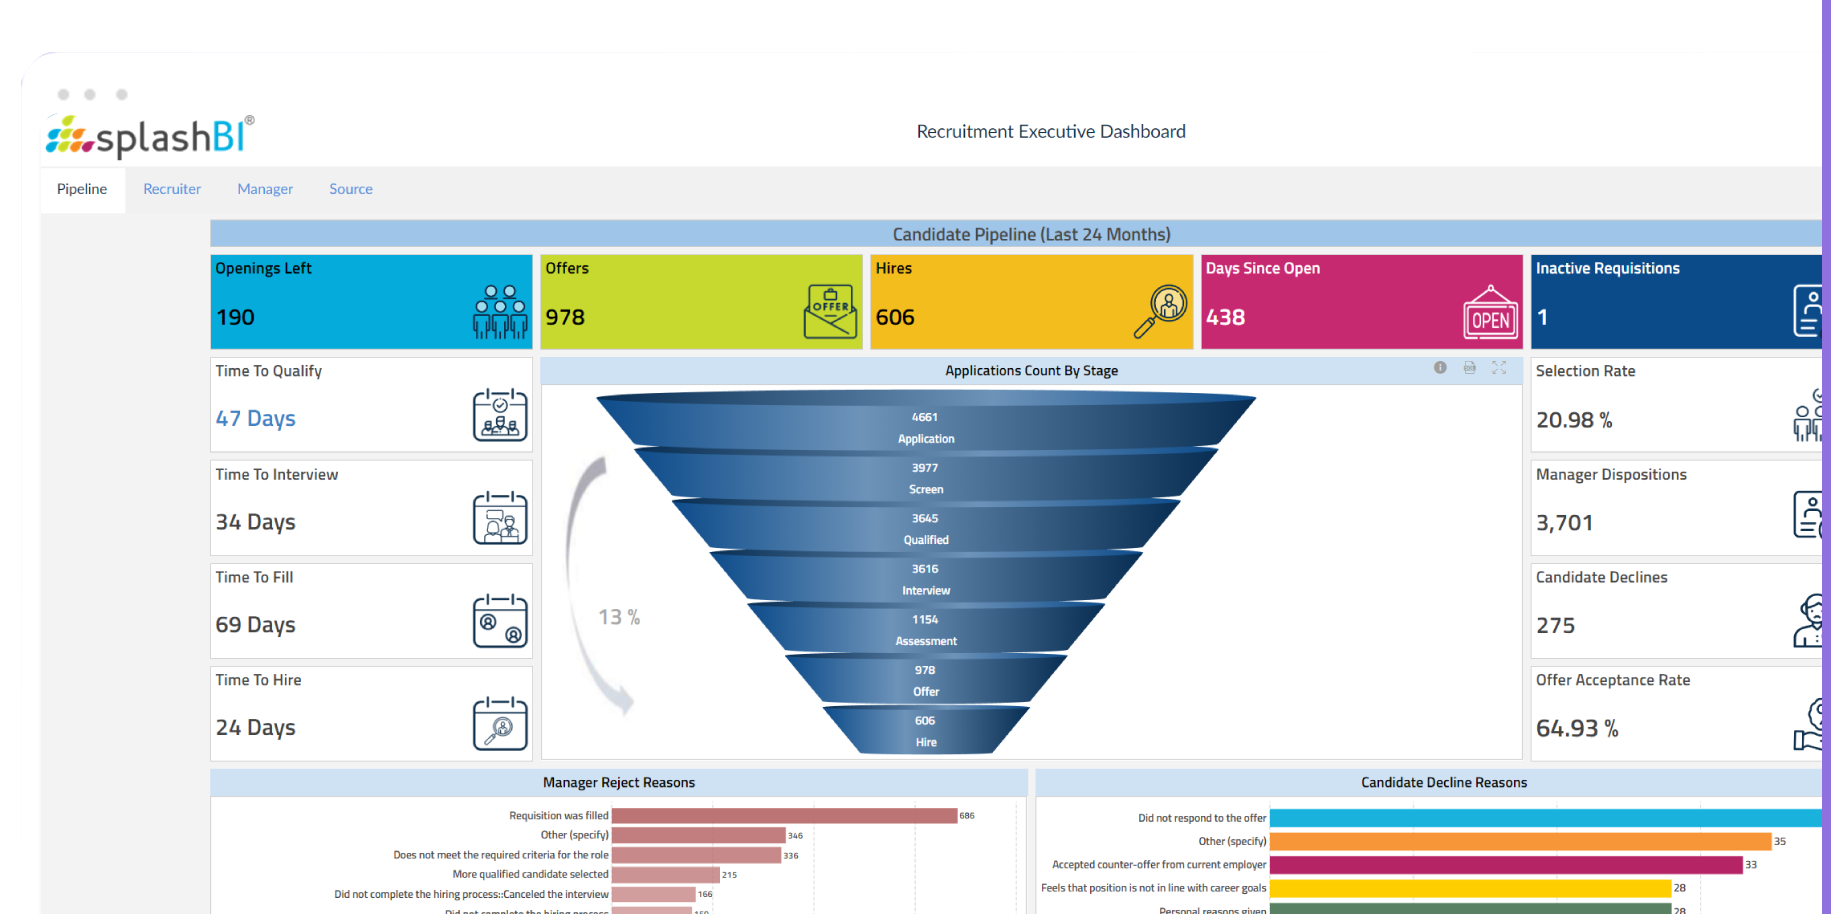
Recruitment Dashboard
Optimize Your Hiring Process
Track Metrics for Better Recruiting
Improve Speed and Accuracy
Reduce Time-to-Hire
Enhance Candidate Sourcing Efficiency
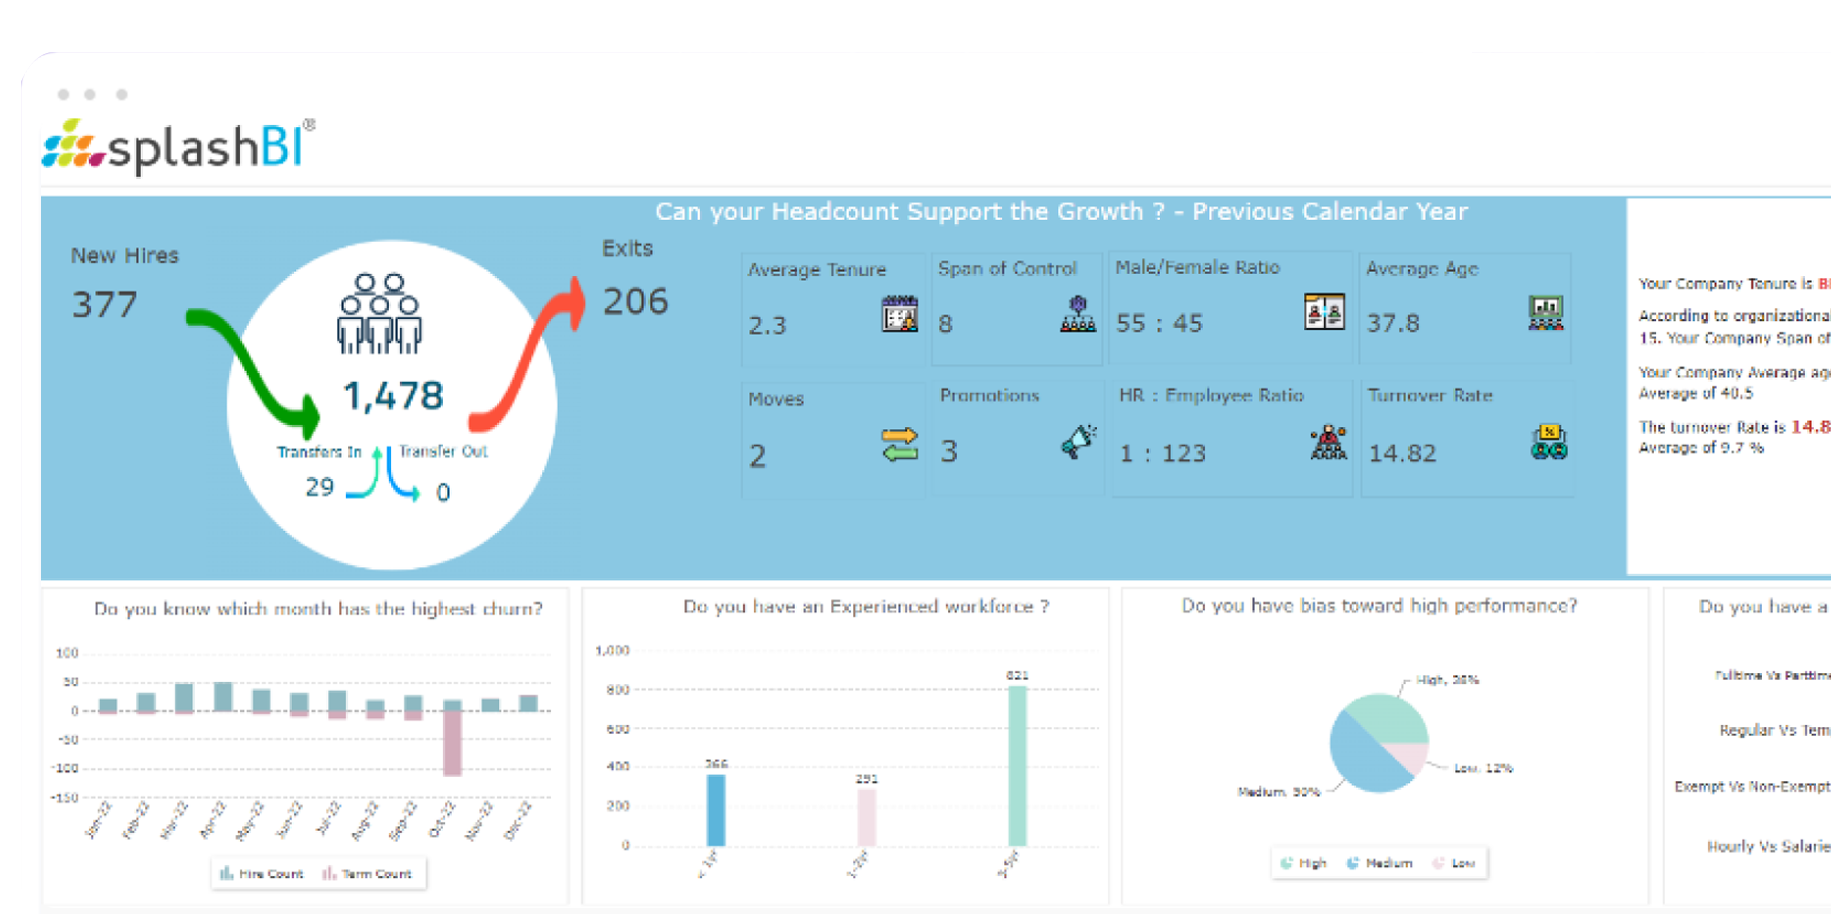
Headcount Dashboard
Analyze Team Size Trends
Insights into Workforce Composition
Monitor Team Growth
Evolving Workplace Dynamics
Increase in Remote Workers
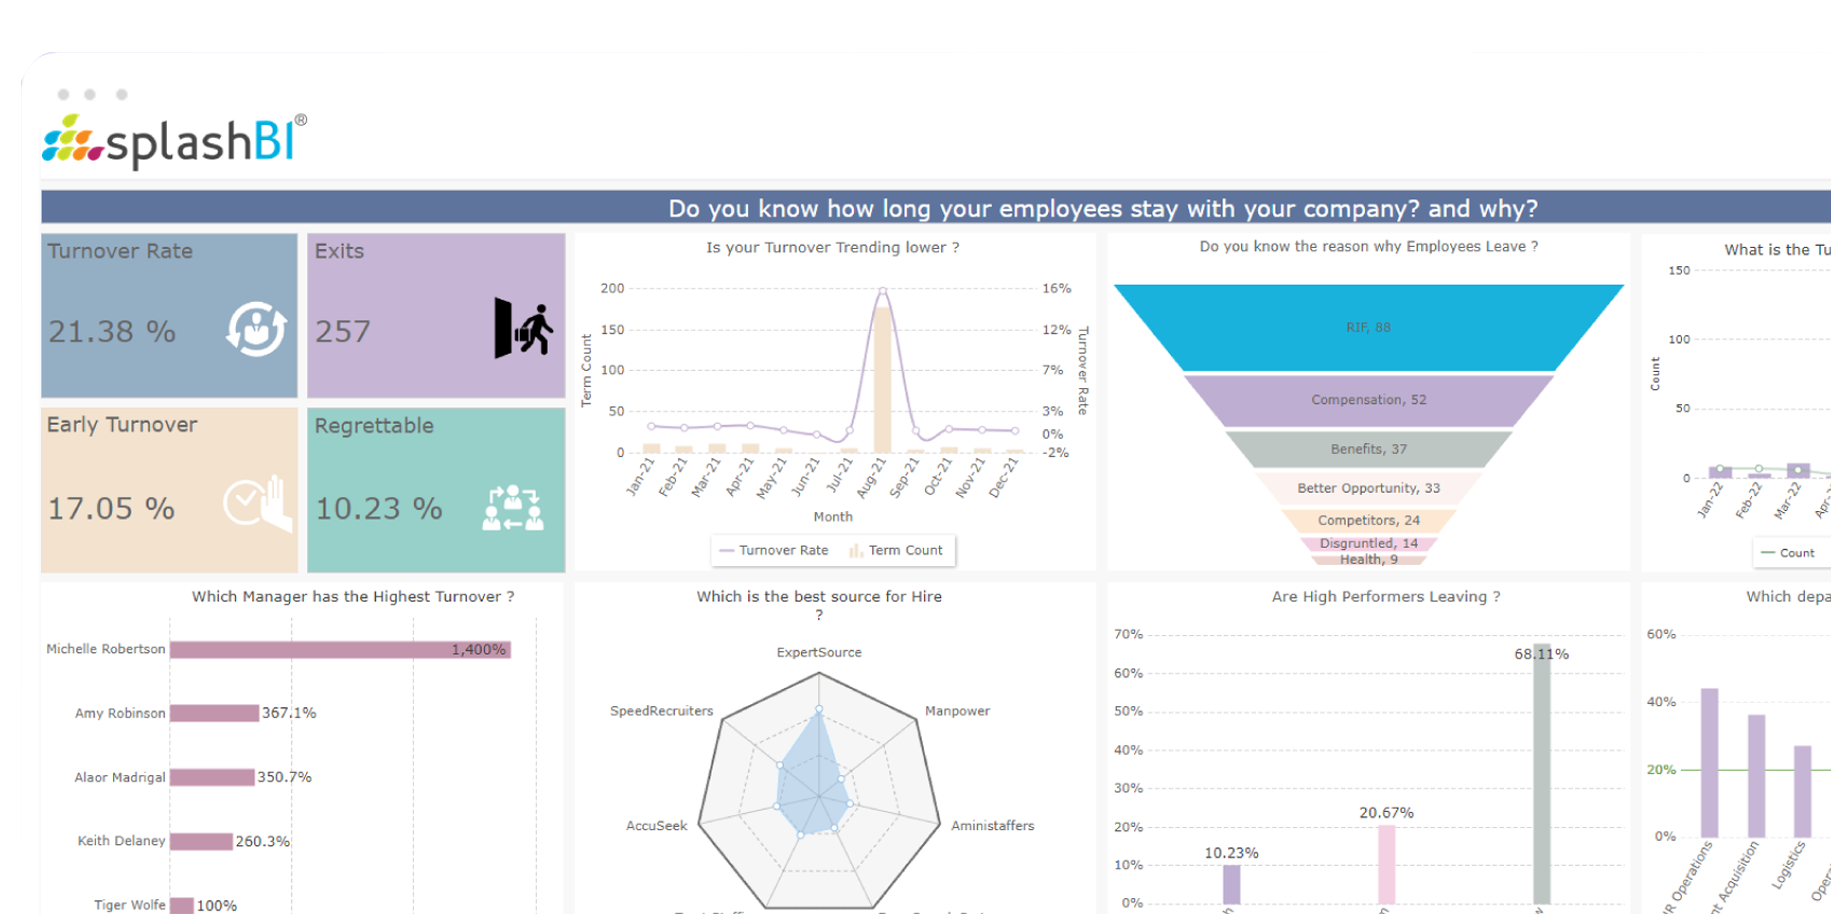
Turnover Dashboard
Understand Employee Exits
Identify Turnover Issues
Mitigate Turnover Challenges
Track Cost Savings
Reduce Turnover Rate
Skill Gap Dashboard
Pinpoint Workforce Skill Gaps
Address Capability Shortages
Highlight Skill Development Needs
Improve Project Deliveries
Boost Critical Skills Coverage
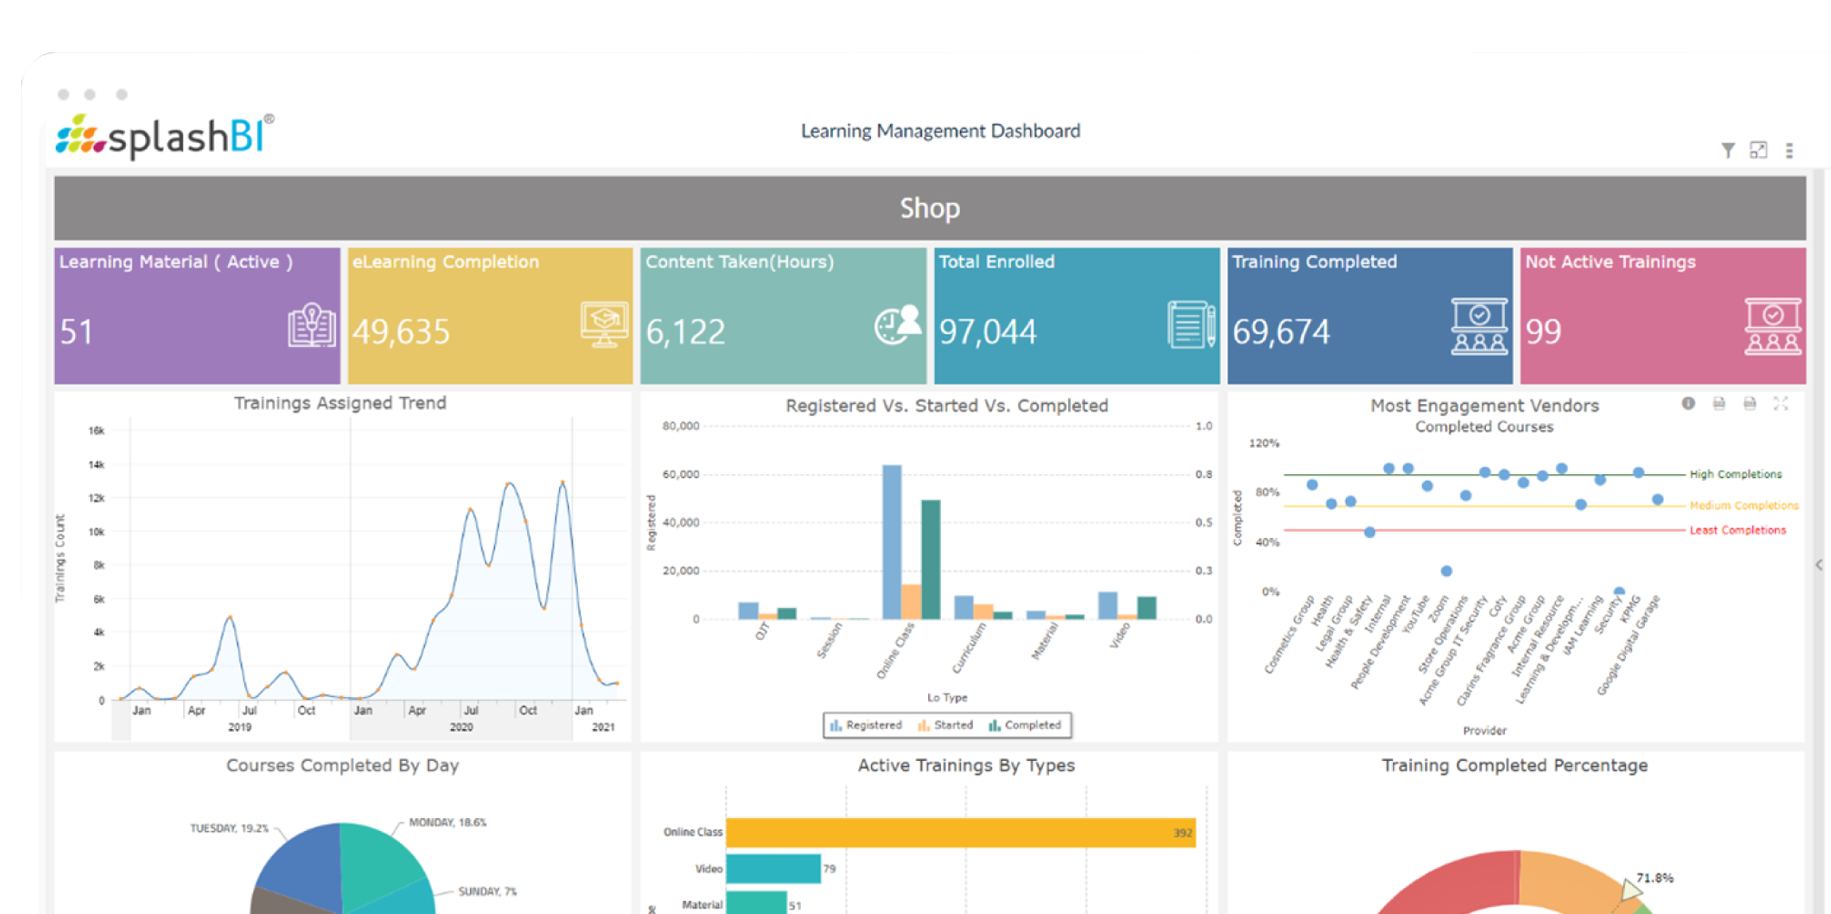
Diversity Dashboard
Foster an Inclusive Workforce
Track Diversity Metrics
Increase Diversity Hiring
Improve Gender Parity
Enhance Inclusion Efforts
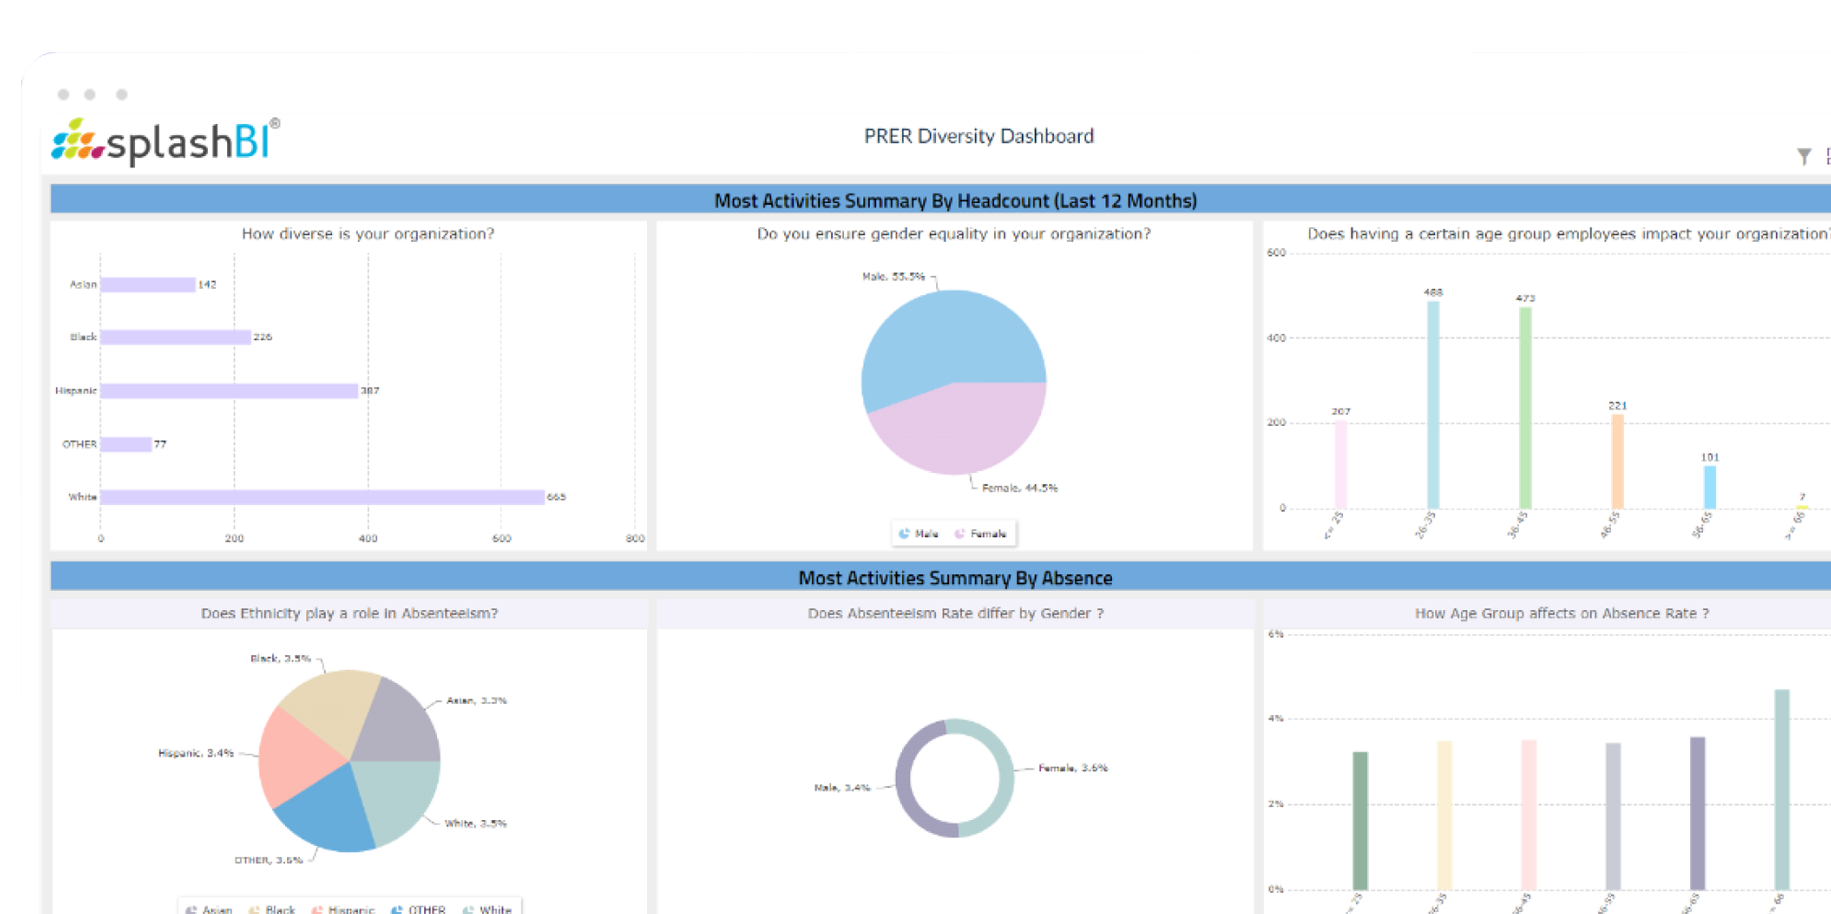
Compensation Dashboard
Ensure Fair Pay Practices
Competitive Market Compensation
Aid Employee Retention
Maintain Pay Equity
Improve Pay Satisfaction
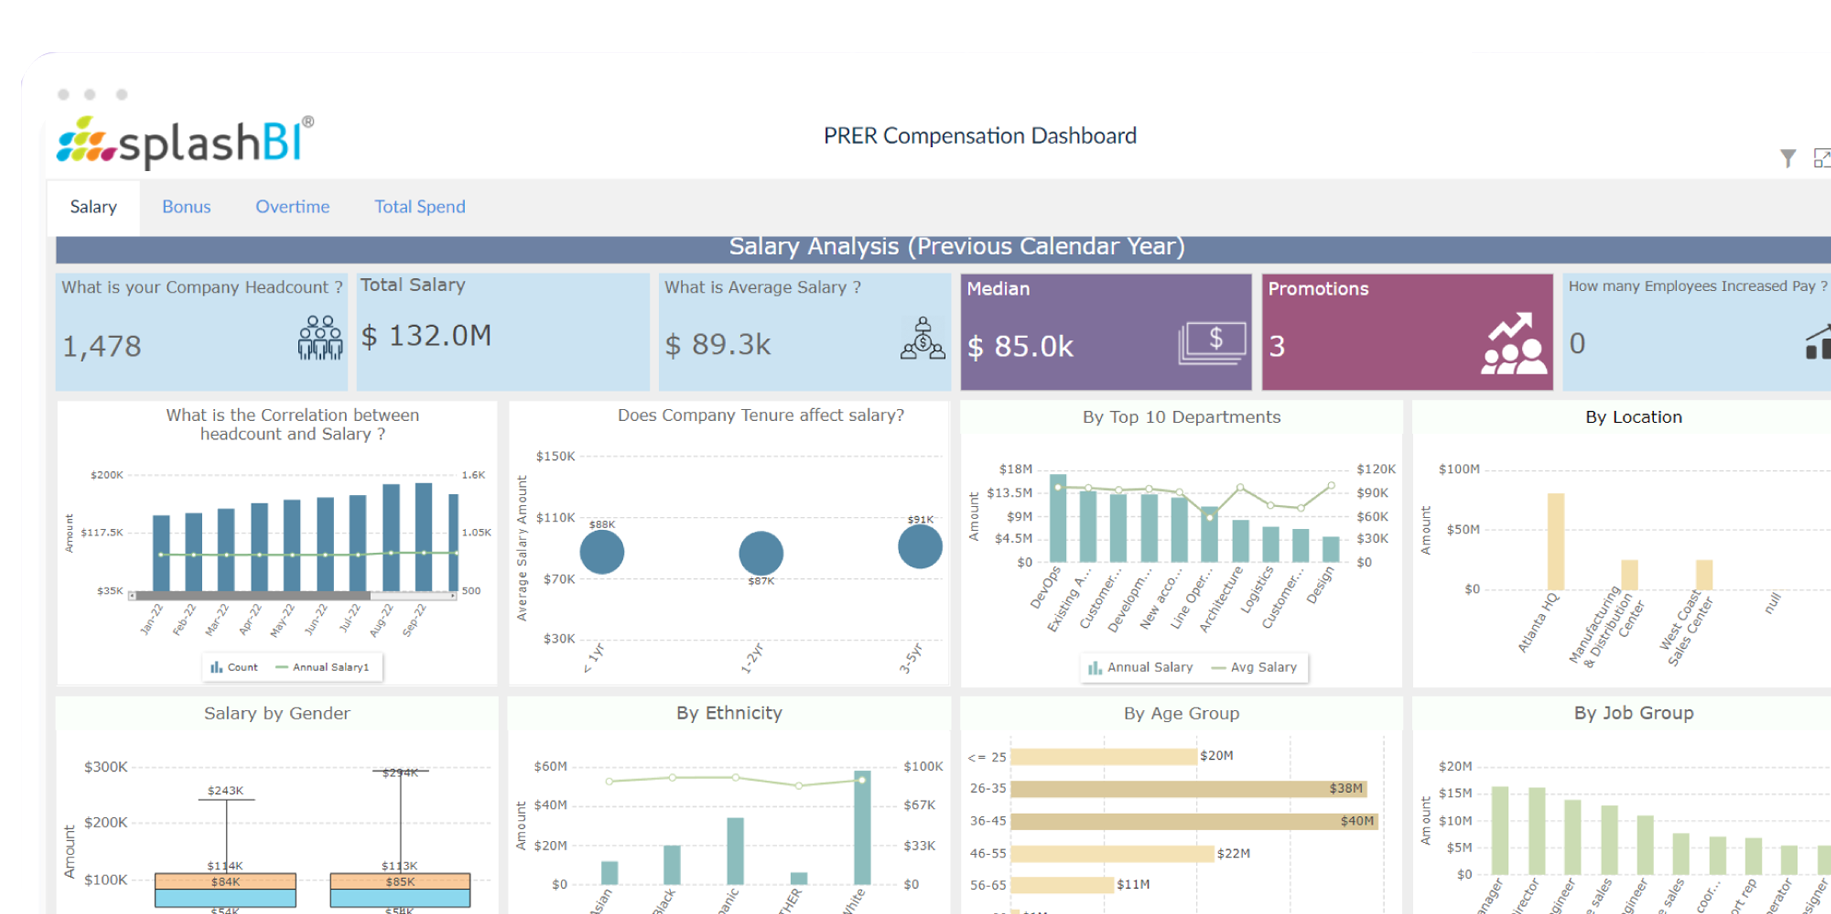
SplashBI Helps HR Leaders Like You
take action with confidence
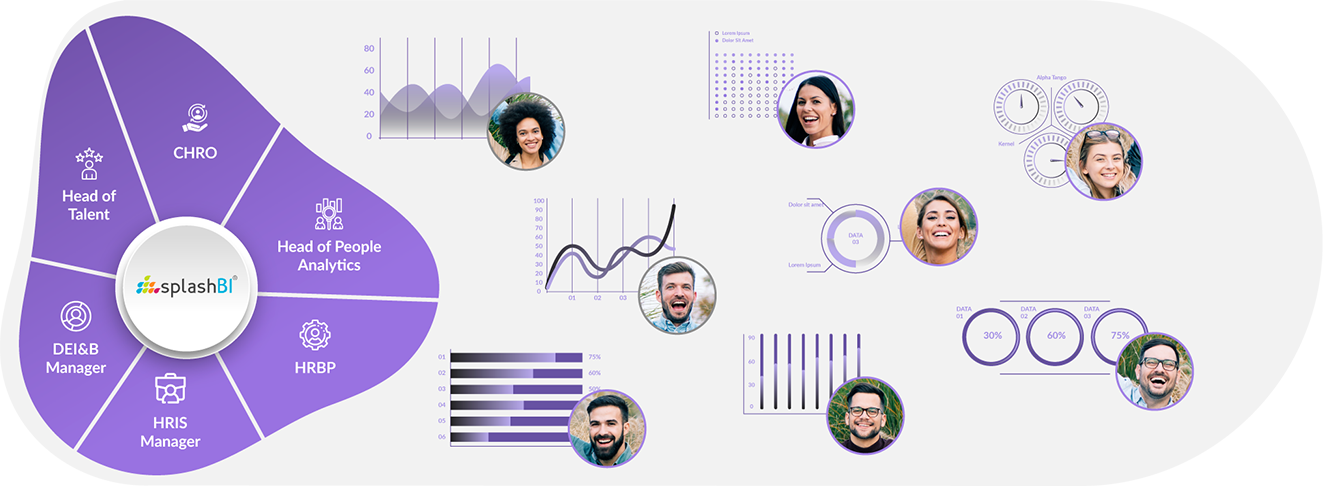
Head of People Analytics
Go beyond reports. Turn data into actionable insights that drive strategic people decisions.
HRIS Manager
Simplify data integration & get deeper insights to empower HR teams.
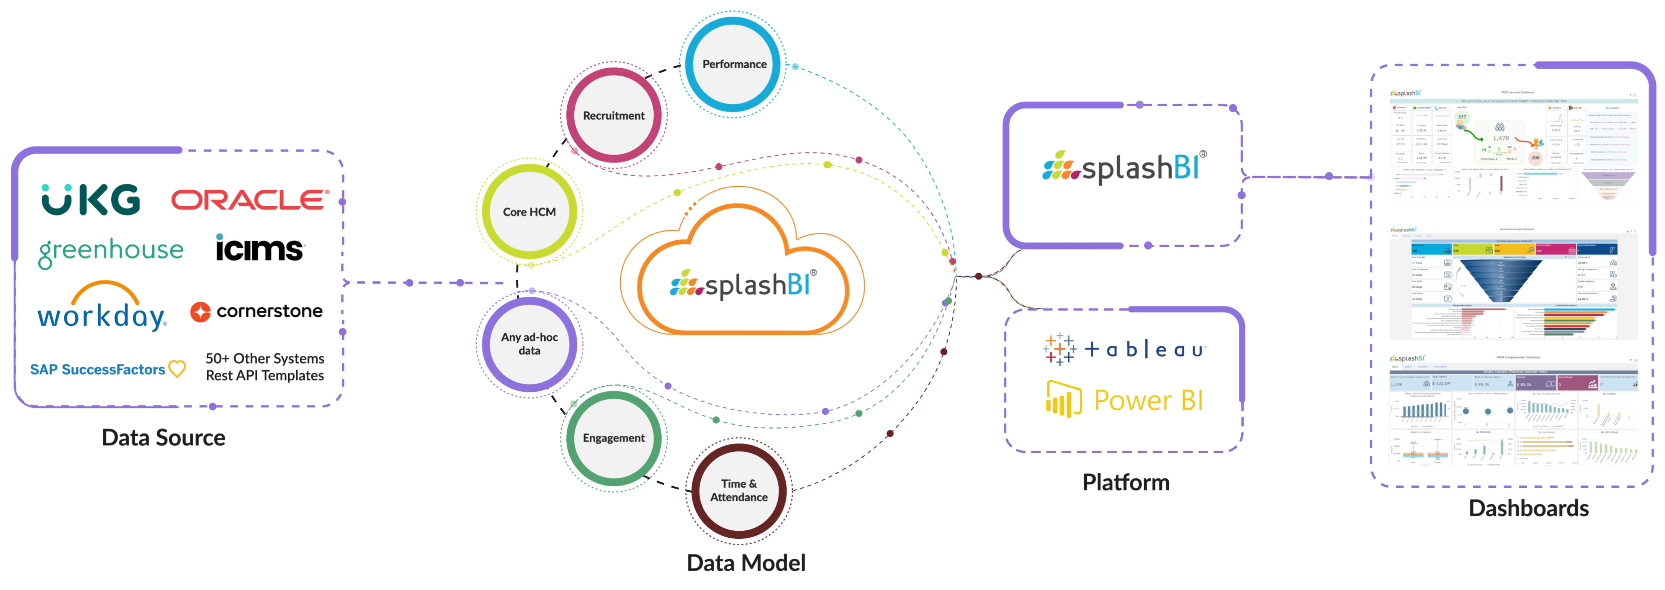
Integration Overview
SplashBI for HR provides over 800+ pre-built reports and dashboards that provide you with the key metrics and KPI’s to enhance your HR and people lifecycle. Combine all your people data into once easy to view single-view platform. With the intuitive insights being pulled from all your different sources across your different HR tools and systems, bringing the information into silos.
Pre-built analytics enable quick and effective number-crunching to give you the insights you need to make better decisions. Being able to visualise data in charts and dashboards makes difficult decisions easier and remove reporting complexities.
The numbers tell a story.
Find yours & build a high-performing workforce.


