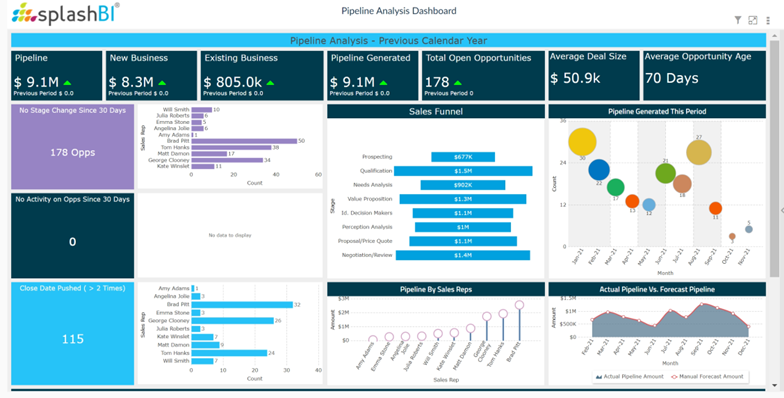
The Sales Pipeline dashboard gives detailed information about the opportunities and where they are in the
sales cycle. This also allows managers to see historical pipeline at any given date, thus allowing to compare
trends for a sales rep/team
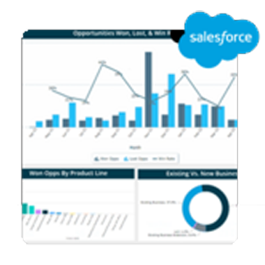
Dashboard Summary
Questions Answered:
• What is our current sales funnel?
• What is our actual vs. forecast pipeline?
• Pipeline By Sales Reps
• Pipeline current activities of opportunities
• And much more.
• What is our actual vs. forecast pipeline?
• Pipeline By Sales Reps
• Pipeline current activities of opportunities
• And much more.
Desired outcomes:
• Health of the sales pipeline
• Track activities and target
• Opportunity movement
• Track activities and target
• Opportunity movement
Contains
- 10 KPI’s
- 8 Charts
