The evolution of business systems and data have really changed how people approach business intelligence and analytics today. Meaningful and valuable data no longer just comes from a single application, nor is it solely managed by IT. Organizations now have applications in the cloud that they subscribe to one day then switch off the next. Other sources of data, such as on premise legacy systems and ERP Systems, are pushing data volumes and velocity at a much greater scale, playing a big part in the SplashBI story.
Additionally, growth of the Internet of Things has been exploding – changing the way businesses and consumers interact with the physical world. With so many connected devices generating so much data in so many different forms (and from so many different sources), there’s often a need to create insights and meaning from this data.
In the world of business intelligence, the demand for self-service BI is louder than ever. Business users are demanding to access more data and information when they need it, without getting IT involved.
The evolution of self-service has transitioned over the years. Gartner predicts “By 2017, Most Business Users and Analysts in Organizations Will Have Access to Self-Service Tools to Prepare Data for Analysis”. (link) SaaS business applications such as SFDC were some of the first to embrace self-service, enabling many companies to stand up systems to support the business without getting IT involved. And if business applications cannot supply the necessary reporting on their own, business users often will continue their self-service journey and usually end up in Microsoft Excel. The downside for users is that pulling data into Excel doesn’t allow for easy refreshing and can often result in overly complex worksheets. Once users get to pivot tables and need to pull data together from multiple sources, it can become extremely difficult to analyze.
This was followed in recent years by desktop data discovery tools, which are especially popular with data analysts. These tools have made it easy to do some of the things that spreadsheets have not excelled at, specifically in the area of data visualizations and visual analysis. These tools have embraced ease of use, speed of analysis, and engaging user experiences. It’s no wonder that the growth of data-discovery tools from a business-driven, or bottom-up approach is now seen as stepping into the bounds of traditional IT-driven business intelligence, known as the top-down approach.
As a result of all of these things, the ideal reporting tool needs to do more than just reporting. This solution needs to offer greater levels of interactivity with the data, and needs to be developed with higher levels of technology. With the right tools, your organization can analyze 100% of its data quickly and easily, regardless of how far the data sits below the surface. Blending different data sets can empower users to explore data on their own without technical assistance from the IT Staff.
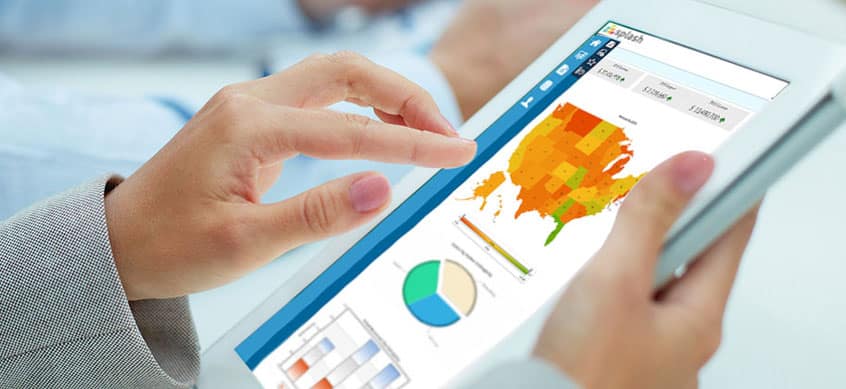
All of these needs have led to the development of SplashBI , a self-service on-demand reporting and dash boarding tool. Designed for end users to be self-sufficient without the assistance of IT, SplashBI allows users to run, ad-hoc, schedule and distribute their reports and visualizations. No matter the data source, SplashBI can connect to it and run your data. From large ERPs like Oracle and PeopleSoft to Cloud based ones like Taleo (HCM Cloud) or Fusion, and even SQL databases and Excel files, SplashBI can get the needed data quickly and easily. In addition, it can be accessed on multiple platforms, like browsers, Excel, and even mobile devices.

