What Is Ad Hoc Reporting in 2025?
Organizations operate in an environment where information changes fast, and decisions must be made even faster. Traditional reports can answer recurring business questions, but leaders often need insights that go beyond preset dashboards or fixed templates. This is where ad hoc reporting steps in.
Gartner predicted that 65 percent of B2B sales organizations will transition to data-driven decision-making by 2026. This shift requires flexible, real-time access to insights, not just static dashboards or monthly summaries. Ad hoc reporting supports this future by giving teams the ability to explore data instantly, validate assumptions, and respond to changing conditions without relying on IT queues or long development cycles.
Ad hoc reporting provides on the fly, customizable, business friendly data exploration. It helps analysts, managers, and executives ask new questions and immediately visualize answers independently. In 2025, as self-service analytics becomes central to how organizations operate, ad hoc reporting is emerging as one of the most important capabilities for agile, confident decision-making.
What Is Ad Hoc Reporting
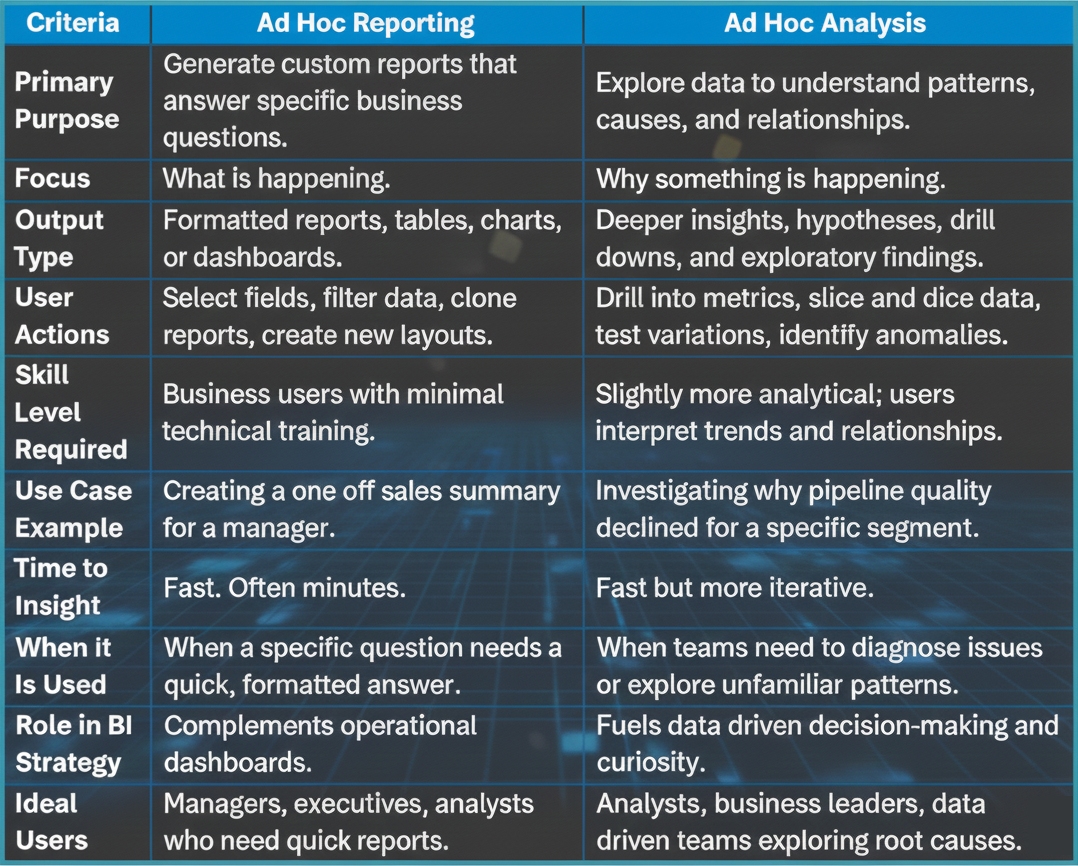
Ad hoc reporting, also referred to as on demand or self-service reporting, is the process of creating custom reports to answer specific business questions that traditional reports do not address. It is built for flexibility. Instead of waiting for a developer to modify a production report, users can select fields, apply filters, visualize data, and generate insights instantly.
The term “ad hoc” comes from Latin and means “for this.” In analytics, it refers to reports created for a particular purpose, scenario, or decision.
Ad hoc reporting meaning in BI is simple. It gives users the ability to explore their data independently. They can clone existing reports, build new ones from scratch, or modify variables based on the business moment.
What Is Ad Hoc Analysis
Ad hoc analysis goes beyond the reporting layer. It involves drilling down into data, slicing metrics, exploring relationships, and identifying anomalies that spark action.
While ad hoc reporting provides formatted outputs, ad hoc data analysis focuses on discovery. It helps business users investigate why something happened, what is changing, and what requires attention.
A simple ad hoc analysis example:
A sales manager notices declining pipeline quality. Instead of waiting for a new dashboard build, they instantly create an ad hoc analysis filtered by segment, deal size, and rep activity to pinpoint where the issue originates.
Ad hoc analysis fuels curiosity and supports exploratory thinking. It has become essential for organizations adopting data democratization.
Ad Hoc Reporting Explained
Ad hoc reporting allows end users to build reports without coding, SQL knowledge, or IT dependency. It fills the gaps left by canned or static reports by enabling highly targeted insights.
Key elements of ad hoc reporting:
- A blank reporting canvas
- Access to well structured and governed data
- Drag and drop field selection
- Ability to clone existing reports
- Filters, prompts, and calculations
- Visualizations such as charts, pivots, and dashboards
- Outputs in Excel, CSV, PDF, HTML, and more
With the right platform, users can generate customized answers in minutes.
Why Is Ad Hoc Reporting and Analysis Important
Business questions evolve constantly. Markets shift, customer behavior changes, and leadership needs timely insights to respond.
Ad hoc reporting and analysis matter because they:
- Empower teams to explore deeper layers of data
- Help individuals act quickly in uncertain business environments
- Remove bottlenecks that occur when IT owns all report creation
- Build a data driven culture where answers are available instantly
- Enable immediate analysis during performance reviews, audits, or strategy planning
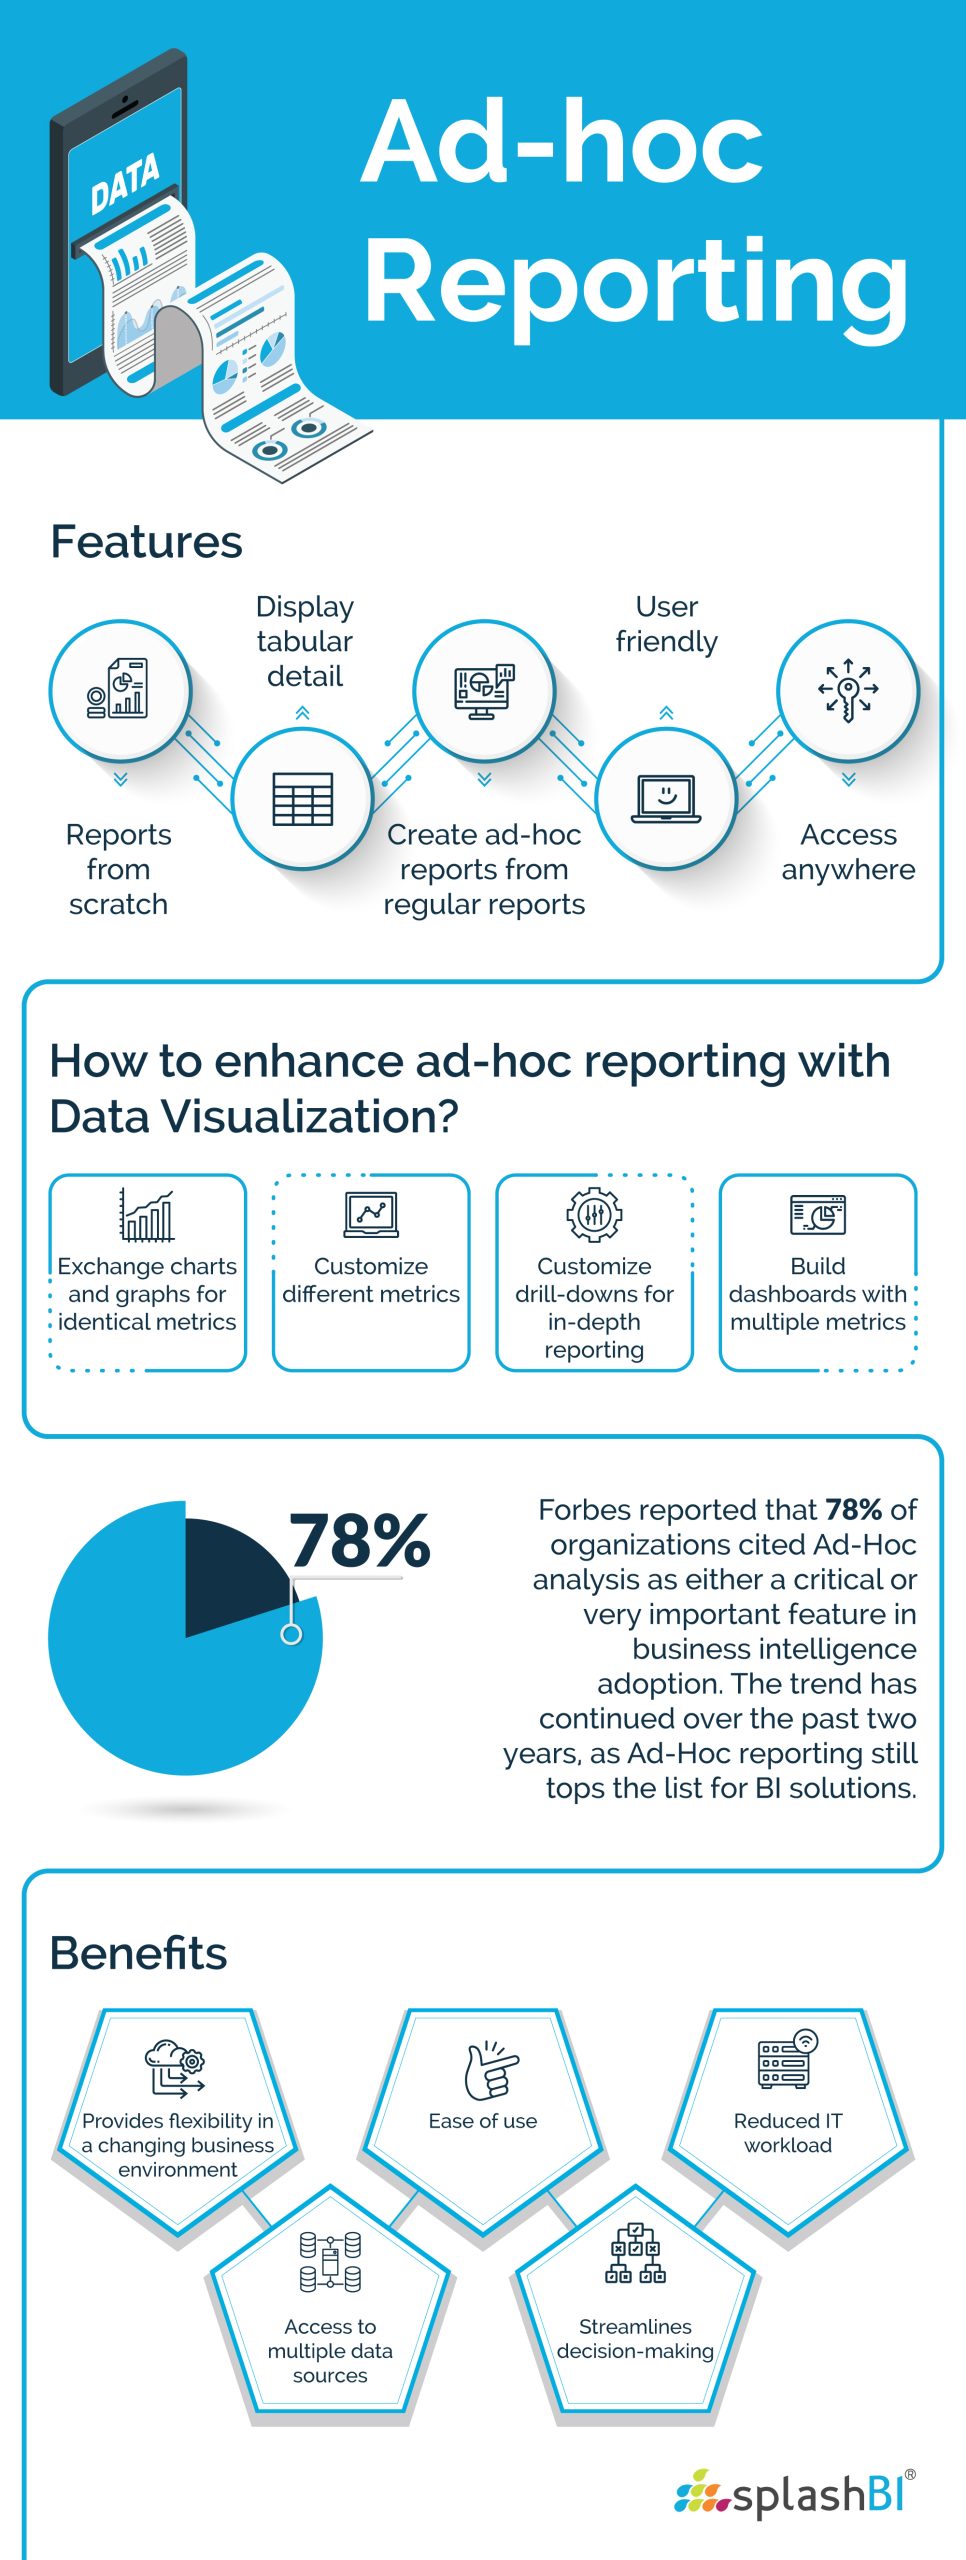
According to Forbes, more than 78 percent of organizations consider ad hoc analysis critical or very important for business intelligence adoption.
What Is Ad Hoc Reporting and Analysis Used For
Ad hoc reporting and analysis are used across all business functions to gain fast, situational insights that regular reports cannot produce.
Ad hoc reporting and analysis use cases
Here are common situations where teams rely on ad hoc reporting:
- Sales: Evaluate lead quality or pipeline variance for a specific region.
- Marketing: Analyze real time campaign performance across channels.
- Finance: Investigate unexpected cost spikes or revenue dips.
- HR: Run workforce turnover analysis for a particular location or job family.
- Operations: Track supply chain delays or vendor performance changes.
- Customer success: Build a one time report on churn risk signals.
Ad hoc reports allow each department to answer pressing questions without waiting for custom development.
Canned Reports vs Ad Hoc Reporting: What’s the Difference
Canned or standard reports are prebuilt, repeatable, and optimized for routine operational needs. They are ideal for monthly reviews, compliance reporting, or dashboards that track ongoing KPIs.
Ad hoc reports, in contrast, are flexible and customizable. They adapt to new questions and one off scenarios. While standard reports provide consistency, ad hoc reporting provides agility.
In a modern BI environment, both must coexist.
Benefits of Ad Hoc Reporting and Analysis
Ad hoc reporting offers several advantages that support business performance.
- Provides Flexibility in a Changing Business Environment
Ad hoc reporting empowers users to modify reports in real time. They can ask specific questions and receive answers immediately, which is crucial in fast moving environments.
- Access to Multiple Data Sources
Modern BI platforms integrate data from multiple sources. Ad hoc reporting tools enable users to bring these sources together and compare insights using filters, sliders, and linked views.
- Ease of Use
Interactive dashboards make ad hoc reporting simple. Users can explore data on the go without digging through large spreadsheets.
- Streamlined Decision-Making
Ad hoc reports provide immediate snapshots of business performance. This makes decision making a collective, fast, and informed activity.
- Reduced IT Workload
When users can create their own reports, IT teams focus on governance and system maintenance rather than endless report requests. This reduces cost and accelerates delivery.
Challenges of Ad Hoc Reporting and Analysis
While powerful, ad hoc reporting also introduces challenges that organizations must manage.
- Data quality issues. If the underlying data is inconsistent, insights may be misleading.
- Lack of governance. Without oversight, users may create conflicting reports.
- Performance concerns. Poorly filtered ad hoc queries can strain systems.
- Security risks. Unrestricted access can expose sensitive data.
- Training requirements. Users need guidance on how to interpret metrics responsibly.
A strong governance layer ensures that ad hoc reporting remains both flexible and reliable.
Goals of Ad Hoc Reporting and Analysis
Empowering decision-makers with data
The primary goal is enabling business leaders to answer their own questions and act with confidence.
Inspiring business leaders to explore data
Curiosity drives innovation. Ad hoc reporting allows users to examine unexpected trends and surface new insights.
Streamlining the decision-making process
When information flows quickly and consistently, decisions improve. Ad hoc analysis compresses cycle time from question to answer.
Examples of Ad Hoc Reporting and Analysis
Real world examples include:
- A marketing lead generating a one time segmentation report to validate campaign targeting.
- A finance manager performing an ad hoc revenue variance drill down for board preparation.
- An HR analyst creating a quick turnover and tenure comparison for a single department.
- A COO examining supply chain delays by vendor, region, and month.
These examples demonstrate how ad hoc reporting supports rapid exploration.
Features of Ad Hoc Reporting and Analysis Tools
High quality ad hoc reporting platforms share several core features:
- Ability to build reports from scratch
- Drag and drop interface
- Tabular and detailed data access
- Option to clone standard reports
- User friendly workspace
- Access from any connected device
- Rich visualization options
- Multiple export formats
- Governed data models for accuracy
- Ability to blend sources
The right solution amplifies both speed and accuracy.
How to Get Started with Ad Hoc Reporting
SplashBI provides a powerful self-service reporting environment designed for ad hoc analysis. The platform allows users to generate custom reports, build dashboards, explore more than 100 visualization types, and access data from multiple sources.
Whether hosted on the cloud or on site, SplashBI delivers interactive business intelligence that supports immediate ROI. The reporting module offers:
- Pixel perfect reporting
- Excel, CSV, PDF, and HTML outputs
- Prebuilt content for finance, HR, and operations
- In depth dashboards
- Seamless integrations across systems
Explore how SplashBI helps teams surface hidden patterns and make data driven decisions.
Conclusion
Ad hoc reporting has become an essential part of modern business intelligence. It enables flexibility, empowers teams to explore data, and supports faster decisions. As organizations prioritise agility, the ability to create custom insights without depending on IT is no longer optional.
With the right self-service platform, ad hoc reporting unlocks deeper understanding, sharpens strategy, and drives operational excellence.
Frequently Asked Questions
A common example is a one-time sales performance report created to understand why a specific region underperformed in the last quarter. The user selects metrics such as revenue, pipeline stage, and rep activity and filters by territory to reveal the cause. These reports are created on demand and are not part of routine dashboards.
The four common types are:
- Comparison reports
- Trend analysis reports
- Exception reports
- Investigative reports
Each serves a different analytical purpose.
A standard report follows a predefined template and is used for recurring needs such as monthly performance tracking. An ad hoc report is created on the fly for a specific question or scenario. Standard reports offer consistency while ad hoc reports offer flexibility.
Ad hoc reporting can lead to inconsistent interpretations if not governed well. It may strain systems when users run complex queries. Security must be enforced to protect sensitive data. Users also need training to avoid incorrect conclusions.


